Fig. 2
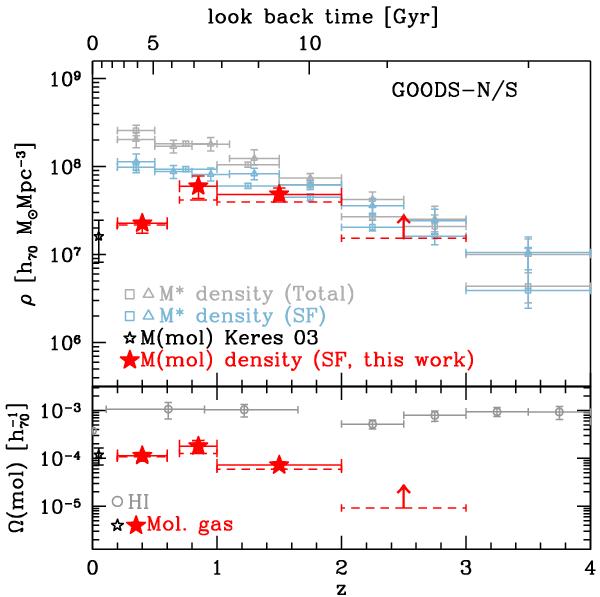
Top: redshift evolution of the molecular gas mass density based on Eq. (1). Red symbols and solid error bars belong to the total mass density, dashed error bars mark lower limits limited to the mass range covered by observations. The black star is computed by integrating the local mass function (Keres et al. 2003). Gray squares and triangles represent the total M ⋆ density reported by Ilbert et al. (2013) and Muzzin et al. (2013), respectively. Light-blue symbols belong to star-forming galaxies only. Bottom: evolution of Ωmol (red symbols, this work) and ΩHI (Prochaska & Herbert-Fort 2004; Zwaan et al. 2005; Rao et al. 2006), where we have divided the latter by 1.3 to avoid counting helium twice.
Current usage metrics show cumulative count of Article Views (full-text article views including HTML views, PDF and ePub downloads, according to the available data) and Abstracts Views on Vision4Press platform.
Data correspond to usage on the plateform after 2015. The current usage metrics is available 48-96 hours after online publication and is updated daily on week days.
Initial download of the metrics may take a while.