Fig. 1
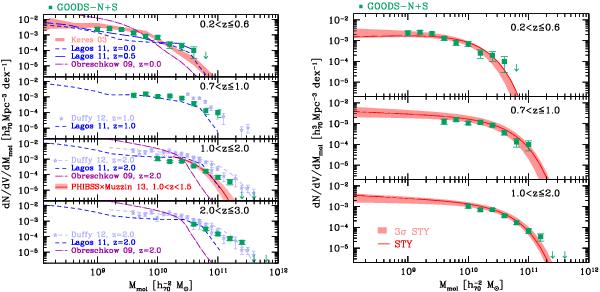
Molecular gas mass function of Herschel galaxies. Left: comparison of the 1/Va estimate (green squares, based on Eq. (1)) with literature data (Keres et al. 2003) and models (Obreschkow & Rawlings 2009a; Lagos et al. 2011; Duffy et al. 2012). The red line and shaded area at z = 1.0−2.0 are obtained by scaling the Muzzin et al. (2013) stellar mass function using the molecular gas fractions reported by Tacconi et al. (2013). When needed, masses found in the literature were scaled by the factor 1.36 necessary to account for helium, and were matched to our set of cosmological parameters. Right: results of the parametric STY evaluation of a Schechter mass function (red lines) and its 3σ uncertainty (shaded areas).
Current usage metrics show cumulative count of Article Views (full-text article views including HTML views, PDF and ePub downloads, according to the available data) and Abstracts Views on Vision4Press platform.
Data correspond to usage on the plateform after 2015. The current usage metrics is available 48-96 hours after online publication and is updated daily on week days.
Initial download of the metrics may take a while.