| Issue |
A&A
Volume 555, July 2013
|
|
|---|---|---|
| Article Number | A16 | |
| Number of page(s) | 13 | |
| Section | Stellar structure and evolution | |
| DOI | https://doi.org/10.1051/0004-6361/201321647 | |
| Published online | 19 June 2013 | |
OGLE-2002-BLG-360: from a gravitational microlensing candidate to an overlooked red transient⋆,⋆⋆
1
Department for Astrophysics, N. Copernicus Astronomical Center,
Rabiańska
8,
87-100
Toruń,
Poland
e-mail:
This email address is being protected from spambots. You need JavaScript enabled to view it.
2
Warsaw University Observatory, Al. Ujazdowskie 4, 00-478
Warsaw,
Poland
e-mail: This email address is being protected from spambots. You need JavaScript enabled to view it.
; This email address is being protected from spambots. You need JavaScript enabled to view it.
; This email address is being protected from spambots. You need JavaScript enabled to view it.
; This email address is being protected from spambots. You need JavaScript enabled to view it.
; This email address is being protected from spambots. You need JavaScript enabled to view it.
; This email address is being protected from spambots. You need JavaScript enabled to view it.
; This email address is being protected from spambots. You need JavaScript enabled to view it.
; This email address is being protected from spambots. You need JavaScript enabled to view it.
; This email address is being protected from spambots. You need JavaScript enabled to view it.
3
The Optical Gravitational Lensing Experiment
4
Universidad de Concepción, Departamento de
Astronomia, Casilla
160–C, Concepción,
Chile
5
Institute of Astronomy, University of Cambridge,
Madingley Road,
Cambridge
CB3 0HA,
UK
e-mail:
This email address is being protected from spambots. You need JavaScript enabled to view it.
6
Max-Planck-Institut für Radioastronomie,
Auf dem Hügel 69,
53121
Bonn,
Germany
e-mail:
This email address is being protected from spambots. You need JavaScript enabled to view it.
7
Department of Astronomy, Ohio State University,
140 W. 18th Ave., Columbus, OH
43210,
USA
Received:
5
April
2013
Accepted:
11
May
2013
Abstract
Context. OGLE-2002-BLG-360 was discovered as a microlensing candidate by the OGLE-III project. The subsequent light curve, however, clearly showed that the brightening of the object could not have resulted from the gravitational microlensing phenomenon.
Aims. We aim to explain the nature of OGLE-2002-BLG-360 and its eruption observed in 2002−2006.
Methods. The observational data primarily come from the archives of the OGLE project, which monitored the object in 2001−2009. The archives of the MACHO and MOA projects also provided us with additional data obtained in 1995−99 and 2000−2005, respectively. These data allowed us to analyse the light curve of the object during its eruption, as well as the potential variability of its progenitor. In the archives of several infrared surveys, namely 2MASS, MSX, Spitzer, AKARI, WISE, and VVV, we found measurements of the object, which allowed us to study the spectral energy distribution (SED) of the object. We constructed a simple model of a star surrounded by a dusty envelope, which was used to interpret the observed SED.
Results. Our analysis of the data clearly shows that OGLE-2002-BLG-360 was most probably a red transient, i.e. an object similar in nature to V838 Mon, whose eruption was observed in 2002. The SED in all phases, i.e. progenitor, eruption, and remnant, was dominated by infrared emission, which we interpret as evidence of dust formation in an intense mass outflow. Since 2009 the object has been completely embedded in dust.
Conclusions. We suggest that the progenitor of OGLE-2002-BLG-360 was a binary, which had entered the common-envelope phase a long time (at least decades) before the observed eruption, and that the eruption resulted from the final merger of the binary components. We point out similarities between OGLE-2002-BLG-360 and CK Vul, whose eruption was observed in 1670−72, and this strengthens the hypothesis that CK Vul was also a red transient.
Key words: stars: individual: OGLE-2002-BLG-360 / stars: peculiar / stars: late-type / stars: mass-loss / infrared: stars / gravitational lensing: micro
Based on observations obtained with the 1.3-m Warsaw telescope at the Las Campanas Observatory of the Carnegie Institution for Science.
We dedicate this paper to the memory of the late Professor Bohdan Paczyński who, from its discovery, traced the strange behaviour of OGLE-2002-BLG-360 with great interest. The analysis of the light curve of this unusual object maintained his excitement for science, despite serious illness.
© ESO, 2013
1. Introduction
Red transients, also known as V838 Mon-type objects, form a small and heterogeneous but also interesting and exciting class of eruptive objects. The powerful outburst of V838 Mon in 2002 (Munari et al. 2002; Crause et al. 2003), accompanied by a spectacular light echo (Bond et al. 2003), raised the interest of astrophysicists in this type of stellar eruption. From their light curves they can be classified as slow or unusual novae, but they are neither. The most important characteristics that significantly differentiate red transients from classical novae is that the former ones evolve to low effective temperatures during outburst and decline as very cool (super)giants. All known red transient remnants are now observed as late M-type giants and/or luminous infrared objects. This allowed Soker & Tylenda (2003) and Tylenda & Soker (2006) to conclude that the red transients cannot be accounted for by thermonuclear runaways (classical nova, late He-shell flash) and to propose that these eruptions result from stellar mergers.
Apart from V838 Mon, in our Galaxy the class of red transients includes V4332 Sgr, whose outburst was observed in 1994 (Martini et al. 1999), and V1309 Sco, which erupted in 2008 (Mason et al. 2010). As extragalactic eruptions of a similar kind one can mention M31 RV (eruption in 1989, Mould et al. 1990), M85 OT2006 (Kulkarni et al. 2007), NGC 300 OT2008 (Bond et al. 2009; Berger et al. 2009), and SN 2008S (Smith et al. 2009).
V1309 Sco appeared to be a clue object in understanding the nature of red transients. An analysis of archive photometric measurements, available from the OGLE project, allowed Tylenda et al. (2011a) to show that the progenitor of V1309 Sco was a contact binary system quickly evolving to its merger.
This finding does not necessarily imply that all the above mentioned objects are stellar mergers. Indeed, it has been seggested that some of the extragalactic transients, especially those called “supernova impostors”, are due to some other phenomenon involving massive stars (Humphreys et al. 2011; Kochanek 2011; Smith et al. 2011) or massive binaries (Kashi et al. 2010), although a stellar merger scenario cannot be excluded either (Kashi & Soker 2013).
In the archives of the OGLE project we have found an object, which suffered from a several years lasting eruption. Already a superficial analysis of the data indicates that it might have been an overlooked red transient. The present paper reports on a detailed analysis of the data on the object, both, from the OGLE photometric measurements as well as from other available sources.
2. The optical light curve
The object bears a designation of OGLE-2002-BLG-360 (hereinafter BLG-360 for short) in the
archives of the OGLE project. Its coordinates are  ,
,
 (, ).
(, ).
The object was discovered on 9 October 2002 by the OGLE Early Warning System (for a description of the OGLE EWS see Udalski 2003)1. Its early (2002−2003) light curve was classified as due a long microlensing event (Paczyński 2003). The subsequent observations, however, ruled out this interpretation.
The OGLE-III project provided us with 2400 measurements in the I Kron-Cousins photometric band in 2001−2009. The data were reduced and calibrated using standard OGLE procedures (Udalski et al. 2008). A typical precision of the measurements was 0.01 mag, when the object was brighter than I ≃ 17.
All the OGLE data are displayed in Fig. 1. The gaps in the data are owing to conjunctions of the object with the Sun. Apart from 2001 (start of OGLE-III) and 2009 (transition period between OGLE-III to OGLE-IV) most of the data were obtained between February and October of each year.
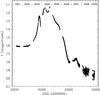 |
Fig. 1 Light curve of OGLE-2002-BLG-360 from the OGLE-III project: I Kron-Cousins magnitude versus time of observations in Julian Dates. Time in years is marked on top of the figure. |
As can be seen from Fig. 1, the object was fairly constant in brightness in 2001 and during first few months of 2002. In August 2002 the object started a slow brightening, continued with a faster pace in 2003. A maximum of I ≃ 12.4 was reached at the end of September 2003. The subsequent decline was observed until the end (mid-November) of the 2003 observing season. The observations resumed in first days of February 2004 revealed, however, the object to be again rising in brightness. A second maximum, about 1 mag brighter than the first one, was observed in April 2004. It was followed by a 0.5 mag drop and a subsequent resumption of the brightening. A third maximum, probably even brighter than the second one, presumably occurred in October−November 2004. The conjunction of the object with the Sun did not allow us to establish neither the date of the maximum nor the maximum brightness. A maximum recorded brightness was of I = 11.29 and it was observed on 21 October 2004.
The observations resumed in February 2005 showed the object to be fading. The decline
continued the entire 2005 season and most of the 2006 year. During two years the object
dropped in brightness by ~7 mag in the I band. In September the object
stabilized at I ≃ 18.0. In 2007, a slow rise lasting until July 2007 and a
subsequent decline formed a shoulder in the light curve of BLG-360. In 2008 and 2009 the
object continued fading. BLG-360 is situated in a crowded stellar field and has a ~19 mag
blending field star at an angular distance of ~0 4. Depending on
the quality of the OGLE images the companion more or less contaminated the measurements of
BLG-360, when the later was of comparable or lower brightness than that of the companion.
This was the main reason of the scatter of the observational points seen in Fig. 1 in 2008. In 2009, visual inspection of the images shows
that BLG-360 was practically invisible and the OGLE measurements refer rather to the
scattered light from the companion.
4. Depending on
the quality of the OGLE images the companion more or less contaminated the measurements of
BLG-360, when the later was of comparable or lower brightness than that of the companion.
This was the main reason of the scatter of the observational points seen in Fig. 1 in 2008. In 2009, visual inspection of the images shows
that BLG-360 was practically invisible and the OGLE measurements refer rather to the
scattered light from the companion.
The phase III of OGLE terminated in May 2009. The OGLE-IV resumed observations in March 2010. Since that date until the present epoch no measurable object has been seen at the position of BLG-360. We can establish a conservative upper limit to the present brightness of BLG-360 to be I ≳ 21.
3. OGLE-2002-BLG-360 as a red transient
Apart from the observations in the I filter, OGLE-III also provided us with 16 measurements of BLG-360 in the V filter. This allowed us to study the evolution of the V − I colour during the eruption of the object. The results are displayed in Fig. 2.
In 2001, i.e. before the eruption, the object had a colour V − I = 3.23 ± 0.05. When interpreted with standard colours of giants (luminosity class III) with no interstellar reddening, it would imply a spectral type of M 5−6. If the star were reddened with EB−V ≃ 1.0 (see below) then the spectral type would be ~M 1.
During the initial rise in August 2003, the colour was slightly bluer, i.e. V − I ≃ 2.95. However, at the end of October 2003, when the object was declining after the first maximum, the colour became significantly redder, i.e. V − I ≃ 4.1. The reddening tendency was continued in course of the eruption with V − I being 5.3 in February 2004 (rise to the second maximum), and 7.3−7.9 in April−June 2005 when the object was declining from the eruption. The latter colour implies a spectral type of M 9 or later, almost independently of the assumed interstellar extinction. The real colour of the object in 2005 was probably even redder as the V measurements at a level of 20.5−21.0 mag were likely to be contaminated by faint field stars in the crowded field of BLG-360.
The progressive reddening of BLG-360 during the eruption and decline is also confirmed by a comparison of the archive photometric data from the MOA project to the OGLE-III photometry, as done in Appendix A and presented in Fig. A.2.
The eruption of BLG-360 thus followed the principal characteristic of the red transients, i.e. evolution to progressively lower effective temperature in course of the eruption and decline as a late M-type (super)giant.
BLG-360 also shares other features observed in the light curves of other red transients. The three peaks in the light curve of BLG-360 with the first one being significantly fainter than the two subsequent ones (see Fig. 1) are quite reminiscent of three maxima observed in V838 Mon during its 2002 eruption. However, one immediately notes that BLG-360 evolved significantly slower than V838 Mon. While the peaks in V838 Mon were spanned with roughly one month, those observed in BLG-360 were separated by seven months.
The shape of the rise of BLG-360 observed in 2002−2003, as displayed in Fig. 3, was strikingly similar to that of V1309 Sco observed in 2008 (Tylenda et al. 2011a). It can be fitted with the same formula as in Tylenda et al. (2011a, their Eq. (2)), although the time scale used in the formula has to be significantly longer in the case of BLG-360. Indeed, the rise in BLG-360 lasted almost 14 months, while that of V1309 Sco took about 6 months.
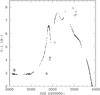 |
Fig. 2 Evolution of the V − I colour of OGLE-2002-BLG-360 – open symbols. The I curve of the object is also shown with small dots. |
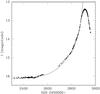 |
Fig. 3 I light curve of OGLE-2002-BLG-360 during its rise to the first maximum. The line shows an exponential fit using the same formula as in Tylenda et al. (2011a, their Eq. (2)) in their analysis of the rise of V1309 Sco. |
Finally, the observational appearance of the remnant of BLG-360 also argues in favour of the red transient interpretation. As discussed in Sect. 2, the object disappeared from the optical in 2009. However, as discussed in detail in Sect. 5.4, infrared data show that in 2010 the object remained very bright in the infrared. This is typical for red transients. The remnants of V838 Mon, V4332 Sgr and V1309 Sco are all infrared bright or even dominated by emission in the infrared (Tylenda 2005; Kamiński et al. 2010; Nicholls et al. 2013).
The eruption of BLG-360 was particularly long and of a low amplitude, when compared to the other red transients. If the amplitude is defined as a difference between the maximum brightness during the eruption and the brightness of the progenitor, then it was of only 5 mag in the case of BLG-360, compared to 7−10 mag observed in V838 Mon, V4332 Sgr, and V1309 Sco (Munari et al. 2002; Martini et al. 1999; Tylenda et al. 2011a). The duration of the eruption, as measured at a half amplitude, was of about 26 months in the case of BLG-360. Those of the other red transients spanned from 1.5 months in the case of V1309 Sco to 3.5 months for V838 Mon.
4. Distance and interstellar reddening
The photometric data alone, i.e. with no spectroscopic observations of BLG-360, do not allow us to derive any reliable estimate of the distance nor of the interstellar reddening. The observed position of the object suggests that it might be a Galactic bulge object. We adopt this as a working hypothesis in the present paper. We show below that this is not an unrealistic possibility.
With this hypothesis a rough estimate of the interstellar extinction can be obtained from the observed reddening of planetary nebulae seen near the position of BLG-360. These are luminous objects and most of those lying towards the Galactic bulge are indeed bulge objects. Within one square degree around the position of BLG-360, we found nine planetary nebulae having reliable estimates of the reddening in the literature (Tylenda et al. 1992; Górny et al. 2009). A mean value and a standard deviation derived from these data are EB−V = 1.03 ± 0.21.
The interstellar extinction can also be estimated using the extinction maps obtained from the OGLE-III survey, as discussed in Nataf et al. (2013). For the position of BLG-360, the maps give AI = 1.515 and EV−I = 1.236, thus AV = 2.75. With a standard value of RV = AV/EB−V = 3.1, one gets EB−V = 0.89. Using RV ≃ 2.5, as found in Nataf et al. (2013), EB−V increases to 1.10.
Without any chance of getting better estimates we adopt in the present study that BLG-360 is at a distance of 8.2 kpc (Galactic centre distance as determined by Nataf et al. 2013) and is reddened with EB−V = 1.0. Following Nataf et al. (2013), we also adopt RV = 2.5.
5. Spectral energy distribution
In archives of several infrared surveys, we have found images and measurements of BLG-360. Together with the OGLE measurements this allows us to study the spectral energy distribution (SED) of the object.
In all analysed cases, the object was significantly more luminous in the infrared than in the optical and shows a clear dust component. Therefore, to interpret the observations we have developed a simple model, in which a central star is embedded in a dusty envelope.
The star is parametrized by its spectral type (or its effective temperature Tstar) and radius Rstar (or luminosity Lstar). Its spectrum is interpolated from a set of standard photometric spectra, the same as in Tylenda (2005) and Tylenda et al. (2011b).
The dust envelope is spherically symmetric relative to the star and has a radius Rdust, and a geometrical thickness ΔR. Dust is uniformly distributed in the envelope and has an uniform temperature Tdust. In our modelling we use ΔR/Rdust = 0.2 (the model results are not particularly sensitive to this parameter). Dust grains are assumed to be composed of silicates with optical properties taken from the web page of Draine2. Grain sizes follow the standard a-3.5 distribution with an upper exponential cutoff at 1.0 μm. The absorption and scattering coefficients, Qabs and Qsca, as well as the anisotropy factor, g ≡ ⟨ cosθ ⟩, are obtained from integrating the corresponding optical properties over the grain-size distribution.
The stellar radiation is absorbed and scattered in the part of the envelope lying in front
of the star and having an optical thickness,  . Thus, the
stellar SED is multiplied by
. Thus, the
stellar SED is multiplied by  . Outward scattering does not
significantly attenuate the stellar radiation, so we defined an effective extinction
coefficient as
. Outward scattering does not
significantly attenuate the stellar radiation, so we defined an effective extinction
coefficient as  (1)The factor
(1 − g) roughly accounts for the isotropic part of the scattering
coefficient. The dust envelope is parametrized by its optical thickness in front of the star
at the effective wavelength of the V band,
(1)The factor
(1 − g) roughly accounts for the isotropic part of the scattering
coefficient. The dust envelope is parametrized by its optical thickness in front of the star
at the effective wavelength of the V band,
 . Then
is obtained
from normalizing Qext to at the
V band.
. Then
is obtained
from normalizing Qext to at the
V band.
In order to calculate the observed emission from the dust envelope, we treat the envelope
as a circular slab or disc of radius
Rdust + 0.5 Δ R, resulting from
projection of the spherical envelope dust distribution on a two-dimensional plane. At a
given position on the disc a local monochromatic intensity,
Iλ, is then obtained from ![Mathematical equation: \begin{equation} \label{i_eq} I_\lambda = B_\lambda(T_{\rm dust})\,[1 - \exp\,(\tau_\lambda)], \end{equation}](/articles/aa/full_html/2013/07/aa21647-13/aa21647-13-eq50.png) (2)where
Bλ is the Planck function and
τλ is the local optical thickness of the
disc. The observed monochromatic flux emitted by the envelope is then obtained from
integrating Iλ over the disc surface and
dividing by d2, where d is a distance to the
object.
(2)where
Bλ is the Planck function and
τλ is the local optical thickness of the
disc. The observed monochromatic flux emitted by the envelope is then obtained from
integrating Iλ over the disc surface and
dividing by d2, where d is a distance to the
object.
At shorter wavelengths, scattering dominates absorption. To account for a random walk of
photons in scattering dominated regions, we defined an effective absorption coefficient as
 (3)or
(3)or
 (4)The optical thickness of
the envelope disc in its centre at the effective wavelength of the V band,
(4)The optical thickness of
the envelope disc in its centre at the effective wavelength of the V band,
 , is related to
through
, is related to
through
 (5)where
Q...(V) stand for appropriate
coefficients taken at the effective wavelength of the V band. The optical
thickness of the disc centre at a given wavelength,
(5)where
Q...(V) stand for appropriate
coefficients taken at the effective wavelength of the V band. The optical
thickness of the disc centre at a given wavelength,  , is then
calculated from normalizing Qabs,eff to
at the
effective wavelength of the V band. Finally, the effective thickness at any
point of the disc, τλ, scales to
as the dust
surface density at the given point to that at the disc centre.
, is then
calculated from normalizing Qabs,eff to
at the
effective wavelength of the V band. Finally, the effective thickness at any
point of the disc, τλ, scales to
as the dust
surface density at the given point to that at the disc centre.
In the above approach there are five free parameters, i.e.
Tstar, Rstar,
Rdust, Tdust, and
, which
determine the model SED. Their values can be estimated from fitting the model to the
observed photometry. All the models were calculated assuming radiative equilibrium in the
sense that the total luminosity outgoing from the model must be equal to the intrinsic
luminosity of the central star.
5.1. Progenitor
In the archives of the Two Micron All Sky Survey (2MASS; Skrutskie et al. 2006) we found measurements of the progenitor of BLG-360 made on 16 July 1998. The catalogue magnitudes are J = 14.07 ± 0.15, H = 12.65 ± 0.05, and Ks = 11.25 ± 0.03. Images obtained with the Midcourse Space Experiment (MSX; Egan et al. 2003) in the A (8.28 μm) band also show a bright object at the position of BLG-360. The observations were made on 31 July 1996. The MSX catalogue gives a flux of 0.15 ± 0.01 Jy. As discussed in Sect. 6, the progenitor of BLG-360 was relatively stable, at least over a period of a few years before the eruption. Therefore we can combine the above data with the OGLE measurements performed in 2001, i.e. V = 19.30 ± 0.05 and Ic = 16.07 ± 0.03 (mean values and standard deviation).
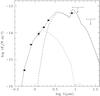 |
Fig. 4 Spectral energy distribution of the progenitor of BLG-360. Symbols: observational data from OGLE-III, 2MASS, and MSX, as well as upper limits from IRAS (see text for more details). Vertical error bars: estimated uncertainties of the measurements. Horizontal error bars: photometric band widths used in the observations. Full curve: model spectrum obtained with the values of the model parameters listed in the first row of Table 1. Dashed curves: individual contributions of the star and the dusty envelope. |
Additionally, the position of BLG-360 was observed by the Infrared Astronomical Satellite (IRAS) in 1983. The object was not detected but using the IRAS Scan Processing and Integration tool3, we were able to put sensitive upper limits on the fluxes of the progenitor in the 12 μm and 25 μm bands. The 3 × rms values for the two bands are 0.36 and 0.27 Jy, respectively. Owing to much lower resolution and a presence of strong far-infrared sources close to BLG-360, we were not able to estimate useful upper limits for the two other IRAS bands at 60 and 100 μm.
Figure 4 presents the observational data (symbols)
and our model of the pre-outburst SED. A giant star of spectral type K 1 (left dashed
curve) satisfactorily explains the observed fluxes in V,
I, and J. The continuum emission at longer wavelengths
result primarily from the dust envelope (right dashed curve). Dust has a temperature of
780 K and the envelope attenuates the stellar radiation with
 . Note
that the model curves are reddened with
EB−V = 1.0. At a
distance of 8.2 kpc the total luminosity of the object is ~290
L⊙. The dust component contributes 80% to the observed
luminosity.
. Note
that the model curves are reddened with
EB−V = 1.0. At a
distance of 8.2 kpc the total luminosity of the object is ~290
L⊙. The dust component contributes 80% to the observed
luminosity.
5.2. Eruption
On 24/25 October 2003, BLG-360 was observed in the K band using the SMARTS 1.3-m telescope at the Cerro Tololo Inter-American Observatory equipped with the ANDICAM-IR camera. We performed aperture photometry of the images calibrating the magnitude scale using catalogue K magnitudes of field stars from 2MASS, DENIS, and VVV surveys. This resulted in K = 7.25 ± 0.15 for BLG-360. The same night, BLG-360 was also measured with OGLE with I = 12.80. For 23/24, 29/30 October and 31 October/1 November we have also OGLE measurements of BLG-360 in the V band. Interpolating from these data, we obtained V = 16.84 for 24/25 October. The object was then fast declining (see Fig. 1), so we assign a conservative uncertainty of 10% to this photometric point.
The above data, converted to fluxes, are shown in Fig. 5. The three observational points cannot be satisfactorily fitted with a single
stellar component. A contribution from dust is necessary to explain the K
measurements if the V and I fluxes are fitted with an
M 3 supergiant. Having just one point we cannot constrain the dust temperature. But from
the analyses done in Sects. 5.1 and 5.3 we found that it would be reasonable to adopt
Tdust ≃ 800 K. With this assumption the model envelope has
 and
contributes 65% to the observed luminosity of
~8.1 × 10³L⊙.
and
contributes 65% to the observed luminosity of
~8.1 × 10³L⊙.
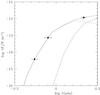 |
Fig. 5 Spectral energy distribution of BLG-360 on 24/25 October 2003. Full symbols: measurements from OGLE (V and I) and CTIO (K) (see text for more details). Curves: model SED obtained with the parameters listed in the second row of Table 1. |
It is clear that the above model results, as derived from fitting a relatively poor observational material, should be treated with caution.
5.3. Decline
In the archives of the Spitzer Space Telescope (Spitzer), we found images covering the position of BLG-360 and taken with the InfraRed Array Camera (IRAC) in its all four channels, i.e. ch1 (3.6 μm), ch2 (4.5 μm), ch3 (5.8 μm), and ch4 (8.0 μm). The observations were obtained on 10−13 May 2007. The object was bright in all images and even partly overexposed, particularly at longer wavelengths. We measured desaturated fluxes of the source using a rectifying procedure of T. Jarrett4. This gave us fluxes, Fν, of 4.10, 4.94, 6.30, and 6.02 Jy for ch1, ch2, ch3, and ch4, respectively. The object was also observed on 12 October 2006 with the Multiband Imaging Photometer for Spitzer (MIPS) but only data in the 24 μm channel turned out to be useful. Using the same procedure as for IRAC data, we derived a flux of 1.47 Jy in this band. All the measurements done on Spitzer data should be accurate to within 10%.
The AKARI/IRC All-Sky Survey Point Source Catalogue (Version 1.0; Ishihara et al. 2010) contains a source at the position of BLG-360 which was measured in the 18.39 μm band with Fν = 2.10 ± 0.08 Jy. The source was observed four times between May 2006 and August 2007 and the given flux is an average value from two of these observations. The catalogue does not specify to which particular dates this flux corresponds. Nevertheless we include the above result in our analysis, although one has to remember that this measurement could have refered to a somewhat earlier epoch than that of the Spitzer observations. The same catalogue does not list any source at the position of BLG-360 in the 9 μm band of the AKARI’s Infrared Camera (IRC), nor we find any measurements for the four bands of the Far-Infrared Surveyor (65, 90, 140, and 160 μm). The future versions of AKARI catalogues, which will account for variable sources, as well as a release of the original maps acquired by AKARI should clarify the point.
At the time of the Spitzer and AKARI observations, BLG-360 was about two years after its third maximum, initially declining and next relatively stable in the I band (see Fig. 1). A mean value derived from the OGLE measurements done between May 2006 and August 2007 is I = 17.37 ± 0.42. No measurements were done in V in this time period, but from the fact that in 2005 the object declined to V = 20.5−21.0, we can put a conservative limit of 21 mag to the V brightness of BLG-360 in 2006/7.
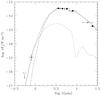 |
Fig. 6 Spectral energy distribution of BLG-360 in May 2006−August 2007. Symbols: V upper limit and I measurement (asterisk) from OGLE, Spitzer IRAC and MIPS measurements (full circles), as well as the AKARI measurement (open circle). See text for more details. Curves: model results obtained with the parameters listed in the third row of Table 1. |
Basic parametres of BLG-360 derived from the SED analysis.
All the above data are presented in Fig. 6. They cover more than a year of the evolution of the object. In the optical the object was variable in this time period, i.e. first declining by ~2 mag during four months and next remaining relatively stable (see Fig. 1). However, as can be seen from Fig. 6, the SED was then dominated by the infrared emission. It is rather unlikely that the object was that much variable in the infrared as observed in the optical. Therefore we believe that the global parameters we derive from the model fitting to the observations are typical for the late decline of BLG-360.
As mentioned above, the SED of BLG-360 in 2006/7 was dominated by the infrared component.
The data from Spitzer and AKARI can be satisfactorily reproduced by a
dust component with Tdust ≃ 850 K and a luminosity of
~1.2 × 10⁴L⊙. This component cannot, however,
explain the observed brightness in I. We therefore assume that the
central object was still seen in the optical although it must have been heavily obscured
by circumstellar dust responsible for the infrared brightness. We therefore add, in our
modelling, an M 4 supergiant (this spectral type is somewhat arbitrary) of
L = 1.25 × 10⁴L⊙. The central
star is attenuated with  . The
curves in Fig. 6 show the results of the above
modelling. For an observer, the star contributes only 7% to the total observed luminosity
of the object.
. The
curves in Fig. 6 show the results of the above
modelling. For an observer, the star contributes only 7% to the total observed luminosity
of the object.
5.4. Remnant
In 2010, i.e. about three years after BLG-360 disappeared from the optical, the object was observed by the Wide-field Infrared Survey Explorer (WISE; Wright et al. 2010) and within the Vista Variables in the Via Lactea (VVV) ESO Public Survey (Minniti et al. 2010).
WISE observations of BLG-360 were made on 19−21 March 2010. Images were taken in all four bands, i.e. W1 (3.35 μm), W2 (4.6 μm), W3 (11.6 μm), and W4 (22.1 μm), and they all show a bright object at the position of BLG-360. From the WISE catalogue, we calculated colour-corrected fluxes of 0.85, 4.39, 5.32, and 3.50 Jy for the bands W1, W2, W3, and W4, respectively. These values are uncertain to ~5%.
The Data Release 1 of the VVV survey also provided us with images covering the position of BLG-360. The thus-far available observations were obtained in August−September 2010. The images taken with the Z (0.89 μm) and Y (1.02 μm) filters do not show any measurable object at the position of BLG-360. The object is, however, clearly seen in the H (1.65 μm) and KS (2.15 μm) bands. Using catalogue products associated with the survey, we estimated the fluxes of 3.1 and 29.5 mJy, with their corresponding uncertainties of 10% and 3% in the latter two bands, respectively.
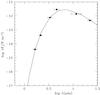 |
Fig. 7 Spectral energy distribution of the remnant of BLG-360 in 2010. Full symbols: measurements from the VVV (H and KS) and WISE surveys in March−September 2010. Full curve: an optically thick dust model with Tdust = 550 K. |
All the above post-outburst measurements are shown in Fig. 7. The full curve in the figure presents a model dust spectrum fitted to the
WISE and VVV data. The dust has a temperature of 550 K and is assumed to be optically
thick, i.e.  . The
need for high optical thickness is motivated by the fact that neither optical (OGLE-IV)
nor near-infrared (Z and Y in VVV) observations revealed
any object at the position of BLG-360. To satisfy the latter we found that
. The
need for high optical thickness is motivated by the fact that neither optical (OGLE-IV)
nor near-infrared (Z and Y in VVV) observations revealed
any object at the position of BLG-360. To satisfy the latter we found that
 . The remnant of BLG-360,
if modelled as in Fig. 7, has a luminosity of
8.2 × 10³ L⊙.
. The remnant of BLG-360,
if modelled as in Fig. 7, has a luminosity of
8.2 × 10³ L⊙.
5.5. Summary of the SED analysis
Table 1 summarizes the parameters of the stellar and dust components that we derived from the analysis of the observed SED made in the previous subsections. First two columns give the dates and the sources of the observational data used to construct the SED. Next four columns present the stellar parameters, i.e. spectral type, effective temperature, as well as radius and luminosity in solar values. The subsequent column gives the optical thickness in the V band of the dust envelope in the line of sight of the star. Last four columns present parameters of the dust envelope responsible for the infrared emission, i.e. dust temperature, luminosity in terms of the stellar value, as well as radius, and dust mass in terms of the solar values. A dust grain specific density of 3.3 g cm-3 was adopted when evaluating the dust mass.
Note that in the SED model for October 2003 (second row in Table 1) the dust temperature is an assumed value (see Sect. 5.2). Consequently the dust envelope parameters derived in this case should be treated with caution. Similarly, the stellar effective temperature (spectral type) in the last row of Table 1 is also an assumed value. In 2010, the central star was not visible and the value of Tstar given in the table follows the observed spectral types of other red transient remnants (V838 Mon, V4332 Sgr, V1309 Sco). Finally, note that the whole SED analysis was made assuming a distance of 8.2 kpc and an interstellar extinction of EB−V = 1.0 (RV = 2.5) (see Sect. 4). Thus the derived radii and luminosities would scale with distance and distance squared, respectively. The star temperature (spectral type) depends on the extinction but not very sensitively. The dust temperature is practically insensitive to the assumed interstellar extinction.
6. Variability of the progenitor
Encouraged by the case of V1309 Sco, whose progenitor showed pronounced variability, which allowed Tylenda et al. (2011a) to study the nature of this object and identify the mechanism of the red transient eruptions, we looked for variability of the progenitor of BLG-360, as well. The OGLE-III monitoring was not sufficiently long before the eruption to provide us with a conclusive observational material for this purpose. Less than two years of the OGLE monitoring of the progenitor (see Fig. 1) show, however, that the object was not particularly variable just before the beginning of the eruption in 2002 (but see below). Fortunately BLG-360 was also monitored in the MACHO and MOA projects, which provided us with observational data for epochs earlier than the beginning of the OGLE-III observations.
The results from the MACHO project are presented and analysed in Appendix B. These data cover the period of 1995−99. Although the mean brightness of the object remained stable over the time span of the observations, the object seemed to show variability of small amplitude, which could be interpreted with a periodicity of ~240 days. Various reasons can be invoked to explain the variability, i.e. binarity, pulsation, or rotation of the progenitor. Quasi-periodic variations in the observed dust-forming mass loss (see Sect. 7.1) could also result in variable screening of the central star. Low quality of the observational data does not allow us to answer if this variability was really present and what could have been its nature.
The photometric data from the MOA project are presented and analysed in Appendix A. The data cover the period of 2000−2005, thus they allow us to study the object in the time period between the end of the MACHO observations and the beginning of the OGLE-III. Unfortunately, there is a systematic problem with the MOA data, particularly important in the progenitor phase, as discussed in Appendix A. We postulate that the reference flux in the MOA data was significantly overestimated. If corrected to match the OGLE light curve (see Appendix A) they can be used together with the OGLE results to analyse the progenitor light curve in 2000−2002, as presented in Fig. 8. Although the scatter of the observational points is significant, particularly in the case of the MOA data (open circles in the figure), Fig. 8 shows that a year before the beginning of the rise, i.e. in 2001, the object dropped by ~0.1 mag compared to the mean brightness in 2000. This resembles the behaviour of V1309 Sco before its eruption (see Fig. 1 in Tylenda et al. 2011a), although in that case the drop was more significant (~1 mag).
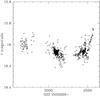 |
Fig. 8 Evolution of the I brightness of BLG-360 in 2000−2002 as obtained from the MOA archives (open circles) and the OGLE-III data (full points). Note that the reference flux in the MOA data was modified, as explained in Appendix A. |
In summary, the progenitor of BLG-360 was not showing any spectacular variability of the sort observed in the case of V1309 Sco. The 240 days periodicity, suggested by the MACHO data, is not certain, mostly due to low precision of the data. The deepening before the start of the eruption, reminiscent of a similar phenomenon observed in V1309 Sco, is a weak effect and in fact not entirely evident due to uncertainties in the MOA data.
In the digitalized plates from the ESO Red Atlas obtained with the 1-m Schmidt Telescope at la Silla Observatory (Schuster 1980), we have found an image taken in August 1980 in the RF filter, which shows a stellar object at the position of BLG-360. Our aperture photometry of the object and field stars, which have measurements in the Guide Star Catalogue 2 (GSC-2), gave RF = 17.4 ± 0.6 for the BLG-360 progenitor. It should, however, be noted that the GSC-2 standards are brighter than ~16.3 mag, so our measurement of BLG-360 assumes an extrapolated calibration, hence the big error. An interpolation between the V and I measurements from OGLE (see Sect. 5.1) gives ~17.9 mag for the effective wavelength of the RF filter (~650 nm). This can be compared to the red magnitude of ~18.1 measured in MACHO (see Appendix B). Given the low angular resolution of the 1980 image, which implies that faint nearby field stars are also included in our measurement from this image, we can conclude that the progenitor of BLG-360 in 1980 was not significantly different in brightness from that observed just before the eruption.
We also found scanned plates from the Palomar Observatory Sky Survey (POSS, red filter) and from the UK Schmidt Telescope (SRC plates, waveband BJ) which cover the position of the OGLE transient5. These observations were obtained in April 1958 and June 1974, respectively. They are of too poor quality to perform any useful quantitative photometry of BLG-360 in its crowded field, but by comparing them to the images of more recent observations smoothed to a similar angular resolution, we can exclude any significant variability of the object at these dates, i.e. the object did not experience an eruption of the type observed by OGLE 2002−2006 in those earlier epochs.
7. Discussion
7.1. Progenitor
The SED analysis made in Sect. 5.1 shows that the progenitor of BLG-360 looked as a K-type giant, ~5 times overluminous as compared to the standard calibration of luminosity vs. spectral-type (Schmidt-Kaler 1982; Drilling & Landolt 2000), surrounded by a dusty envelope, which reprocessed ~80% of the stellar luminosity. The dust optical thickness along the line of sight of the star was ~2.9 in the V photometric band. With the optical properties of the model dust grains used in our SED modelling we obtain that the above value of optical thickness corresponds to a dust column density of Σdust ≃ 4.1 × 10⁻⁴ g cm-2.
The dust was hot (~780 K), which suggests that it was formed in a stellar wind of the
progenitor of BLG-360. Assuming a steady-state spherically-symmetric wind, its dust
mass-loss rate can be estimated from  (6)where
r0 is a radius of the base of the dusty wind and
νwind is a wind velocity. Taking
r0 = 1070 R⊙ (see Table 1) and νwind = 100 km s-1 (which
is of the order of the escape velocity from a ~1 M⊙ star with
Rstar = 30 R⊙ – see first row
in Table 1) one obtains
Ṁdust = 6 × 10⁻⁸ M⊙ yr-1.
With a standard dust-to-gas mass ratio of 0.01 we can conclude that the mass-loss rate
from the progenitor of BLG-360 was of the order of
10-5 M⊙ yr-1.
(6)where
r0 is a radius of the base of the dusty wind and
νwind is a wind velocity. Taking
r0 = 1070 R⊙ (see Table 1) and νwind = 100 km s-1 (which
is of the order of the escape velocity from a ~1 M⊙ star with
Rstar = 30 R⊙ – see first row
in Table 1) one obtains
Ṁdust = 6 × 10⁻⁸ M⊙ yr-1.
With a standard dust-to-gas mass ratio of 0.01 we can conclude that the mass-loss rate
from the progenitor of BLG-360 was of the order of
10-5 M⊙ yr-1.
This mass-loss rate is orders of magnitude too high as for a typical red giant. Therefore it is rather impossible that the progenitor of BLG-360 was a more or less normal red giant, no matter whether being a single star or a primary (brighter) component of a binary system. One could suggest that the object was an asymptotic giant branch star. However, in this case the object would be at least an order of magnitude more luminous than the value given in the first row of Table 1. This would imply a distance at least three times larger than that adopted in Sect. 4. Thus the object would have to be situated in outskirts of the Galaxy and seen through the Galactic bulge, which seems unlikely.
The strong similarity of the rising phase of the BLG-360 eruption, shown in Fig. 3, to the same phase of V1309 Sco (Tylenda et al. 2011a) might suggest a similar nature of the progenitor in both cases. However, contrary to V1309 Sco, the progenitor of BLG-360 did not show any photometric sign of being a contact binary. One can postulate that we observed a more or less pole-on binary. This, however, rises a problem with explaining the strong infrared excess of the progenitor. Contact binaries do not show that huge mass-loss rates as the value derived above. Moreover, the luminosity of ~290 L⊙, as derived in Sect. 5.1, is also far too high for a typical contact binary. The latter could be simply solved by saying that the distance of BLG-360 is much shorter than the value adopted in Sect. 4. A factor of ten shorter distance would bring the luminosity to an acceptable value. This would not, however, solve the problem of the mass-loss rate. As can be seen from Eq. (6), the mass-loss rate would decrease only by a factor of 10, still remaining on an unacceptably high level. One can invoke that the infrared excess is not a sign of a strong, more or less spherical, mass loss but is produced by a disc-like or torus-like dusty envelope formed by mass outflow in the equatorial plane of the binary. This is what is expected in the case of a contact binary approaching its merger (as discussed in Tylenda et al. 2011a). However, in this case the central object would be directly seen (no significant extinction of the pole-on binary from the envelope) and it would be difficult to understand, why the envelope was ~4 times brighter than the central binary (see Sect. 5.1).
The above problems related to the strong infrared excess and the lack of any significant photometric variability over a time period of at least 7−8 years before the eruption can be solved if we postulate that the progenitor of BLG-360 was a common-envelope binary, namely a binary system that had entered the common-envelope phase a certain time (at least ~10 years) ago. The scenario could have been as follows (for more details see, e.g. Ivanova et al. 2013). The more massive companion of a binary filled its Roche lobe when evolving from the main sequence toward the red giant branch. This resulted in an initially fast mass transfer and formation of a common envelope. After a relatively violent initial phase of the common envelope (plunge-in), the object entered a rather gentle phase (spiral-in) when the components were slowly spiralling in inside the envelope. This would be the phase, or rather its end, that we observed in 1995−2001. The binary, deeply embedded in the envelope, was not directly seen, which explains the lack of any significant variability of the object. A slow dissipation of the orbital energy and the related transfer of the orbital momentum to the envelope would have resulted in the intense mass outflow.
7.2. Eruption
The spiral-in process apparently accelerated in 2002, which resulted in an exponential rise of the object brightness lasting ~14 months (see Figs. 1 and 3). This most likely led to a final merger of the binary components, or rather of their cores, in 2004.
The light curve of BLG-360 (see Fig. 1) shows three pronounced peaks during the eruption. One can even claim that the phenomenon also repeated in the decline: a sort of slow-down in the decline in 2005 and a clear halt and even rise in brightness in 2007. A similar phenomenon of multiple peaks was also observed in the case of the 2002 eruption of V838 Mon (see e.g. Munari et al. 2002; Crause et al. 2003). The origin of the phenomenon is not clear. In the case of V838 Mon, Tylenda & Soker (2006) proposed that the peaks could have been reminiscence of a violent merger of a binary with a highly eccentric orbit. This is not likely to be the case of BLG-360, given our analysis of the pregenitor in Sect. 7.1. The slow and smooth rise of BLG-360 to its maximum, lasting 14 months, shows that the merger process started well before the first maximum and that from its very beginning the binary was deep in the common envelope. Perhaps the multiple peaks result from a certain sort of instability appearing at the very merger and resulting in a quasi periodic oscillations of the merger envelope.
BLG-360 increased its I brightness by a factor of 100 when its maximum is compared to the brightness of the progenitor. If the same factor applies to the luminosity, then the object would reach ~3 × 10⁴ L⊙. The general tendency of the object to become progressively redder in the V − I colour (see Fig. 2) however implies a progressively higher bolometric correction – thus an increase of the luminosity much greater than that of the I brightness. Unfortunately, the lack of infrared measurements during the eruption does not allow us to study this important point in detail. Our attempt to investigate the SED in October 2003 (see Sect. 5.2) gave a value of ~8 × 10³ L⊙. This is however an uncertain value as based only on measurements in the V, I, and K bands, while a significant part of the expected flux in the infrared escaped measurements. The object was then in a significant decline from the first maximum and much below its maximum in 2004. A similar analysis made on the data obtained in 2007 (see Sect. 5.3) gave a more reliable value of ~1.3 × 10⁴ L⊙. But the object was then in a deep decline, i.e. ~6 mag in I below its maximum brightness. If the same factor is applied to the luminosity then we get ~3 × 10⁶ L⊙ in maximum. This value is, however, rather an upper limit to the maximum luminosity since the observed decline in I was probably not only due to the decline in luminosity but also due to the reddening of the object and dust formation in the outflowing matter. It seems reasonable to conclude that during the eruption BLG-360 increased in luminosity at least by a factor of 100, but a factor of 1000 cannot be excluded. Its maximum luminosity was probably of a few × 104 L⊙.
7.3. Remnant
The luminosity of the BLG-360 remnant in 2010 is relatively well determined (see Sect. 5.4), more or less at the same level of accuracy as that in 2007. During three years the object declined 35% in luminosity (see Table 1). The remnant is now completely embedded in dust. The dimensions of the dusty envelope are of ~1 × 10⁴ R⊙ (see Table 1), i.e. some 50 AU. It expanded by a factor of 1.9 between 2007 and 2010, which corresponds to an expansion velocity of ~35 km s-1. This measures the expansion of a sort of effective photosphere of the dusty envelope, so it need not to be the expansion velocity of the outflowing matter. Nevertheless, the above value is close to the escape velocity from a solar-mass star inflated to ~300 R⊙ (see Table 1).
As can be seen from Table 1 (last column), the mass of dust seen in the infrared was increasing with time. This can be interpreted as evidence of an increasing mass of the outflow during the eruption. The value obtained from the observations in 2010 can be considered as a measure of the total mass lost during the eruption. The dust envelope was optically thick in 2010 so we can derive only a lower limit to the mass. If we adopt a standard value of 0.01 of the dust-to-gas mass ratio, then we can conclude that BLG-360 lost at least 10-3M⊙ during its eruption.
7.4. CK Vul: an analogue to BLG-360?
CK Vul, also known as Nova Vul 1670, is usually classified as a slow classical nova (e.g. Shara et al. 1985) or a final He-shell flash post-AGB object (e.g. Evans et al. 2002). However, Kato (2003) proposed, following the merger scenario for V838 Mon of Soker & Tylenda (2003), that the eruption of CK Vul might have also resulted from a stellar merger. The main argument based on similarities in the light curve of CK Vul and V838 Mon. The idea was not, however, overwhelmingly accepted, mostly due to the time scale of the eruption, which in the case of CK Vul was ten times longer than in V838 Mon.
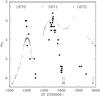 |
Fig. 9 Visual light curve of CK Vul (Nova Vul 1670) compared to the I curve of BLG-360. Full symbols: eye estimates of CK Vul in 1670−1672 (the data are from Shara et al. 1985, arrows: upper limits). Small dots: I measurements of BLG-360 in 2003−2005. Notes: the BLG-360 light curve is shifted in the magnitude scale to match the brightness of CK Vul, the time scale of BLG-360 is increased by a factor of 1.4. |
Figure 9 compares the light curve of CK Vul to that of BLG-360. The results of eye estimates of the CK Vul brightness was taken from Shara et al. (1985). The I measurements of BLG-360 were shifted in the magnitude scale to match, more or less, the observed magnitudes of CK Vul. Also the time scale of BLG-360 was multiplied by 1.4, to get a spacing between the maxima similar to that in CK Vul.
As can be seen from Fig. 9, in the case of CK Vul as well as in BLG-360, three distinctive peaks are clearly present in the light curve. The time span between the peaks is also similar in both cases, i.e. ten months in CK Vul versus seven months in BLG-360. Thus the light curve of BLG-360 is much closer to that of CK Vul than it was in the case of V838 Mon.
Of course there are clear differences between the light curves of both objects. The third maximum is fainter and the minimum between the second and third peaks is deeper in CK Vul than in BLG-360. Part of these differences can be attributed to the differences in colour sensitivity between the eye and the I filter, especially if the object becomes very red.
Futher similarities between both objects can be found in observational appearances of the remnants. Both, in the case of CK Vul and BLG-360, no remnant is visible in the optical. Although an emission nebula was found arround the position of CK Vul, no optical stellar-like object has so far been identified (e.g. Shara et al. 1985). However, similarily as in the case of BLG-360, a bright infrared source is clearly seen at the position of CK Vul (Evans et al. 2002).
We thus conclude that the case of BLG-360 provided evidences favouring the hypothesis that the eruption of CK Vul observed in 1670-72 was of a red-transient type.
7.5. Similarities to NGC 300 OT2008
The progenitor of BLG-360 showed a strong infrared excess, already at short wavelengths (JHK), indicating that it was an evolved object with an intense mass-loss. In this respect the object was different from the other Galactic red transients. The photometric data on the progenitor of V838 Mon do not show any infrared excess up to the K band (Tylenda et al. 2005). In the case of V4332 Sgr the situation is less clear. No near infrared measurements are available for the progenitor and the object was too faint to be detected in the IRAS survey. The progenitor of V1309 Sco was not a bright infrared source (Nicholls et al. 2013).
From the point of view of the infrared behaviour, BLG-360 shows clear similarities to the extragalactic optical transient NGC 300 OT2008. The progenitor of the latter object was identified as a luminous infrared source (Prieto 2008; Berger et al. 2009). Similarly as BLG-360, the object also showed a pronounced infrared excess during the eruption (Prieto et al. 2009) and became completely embedded in dust after the outburst (Prieto et al. 2010). It is thus tempting to suggest that the progenitor of NGC 300 OT2008 could also have been a common-envelope binary and that its final merger resulted in the observed outburst.
NGC 300 OT2008 was significantly brighter than BLG-360. At maximum the object reached 5 × 10⁶ L⊙, compared to a few × 104 L⊙ if BLG-360 is a Galactic bulge object. A similar factor also differs the brightnesses of the progenitors. The time scale of the eruption of NGC 300 OT2008 was, however, a factor of 10 shorter than that of BLG-360. The above differences can be accounted for by differences in masses. The progenitor of NGC 300 OT2008 was a young massive (binary) object (Bond et al. 2009; Berger et al. 2009), while that of BLG-360 was probably an old low-mass Galactic bulge object. A denser common envelope in the former case could explain the more luminous but shorter eruption.
8. Summary
OGLE-2002-BLG-360, originally discovered as a gravitational microlensing candidate, appears to be an overlooked red transient. This interpretation is primarily supported by the observed evolution of the V − I colour, which shows that the object became progressively cooler in course of the eruption and the decline. In the end, the object disappeared from the optical, remaining bright in the infrared. Clearly the remnant is now completely imbedded in dust formed in matter lost by the object during its eruption.
The eruption of BLG-360 is, in some aspects, different from those of the other Galactic red transients, i.e. V838 Mon, V4332 Sgr, and V1309 Sco. First, it was less violent, in the sense that the amplitude of the outburst was only 5 mag, compared to 7−10 mag in the other objects. Second, it lasted much longer, i.e. about 3 years compared to months in the other cases. The light curve of BLG-360 and the duration of its eruption bears, however, strong similarities to CK Vul erupted in 1670-2, strengthenning the idea that the latter was also of the red-transient type. We point out similarities in the infrared evolution of BLG-360 and the extragalatic optical transient NGC 360 OT2008. We thus speculate that the latter event could be of a similar nature as the eruption of BLG-360.
We interpred the observations of BLG-360 in terms of a merger of an evolved low-mass binary. The lack of any significant variablilty of the progenitor over decades before the eruption, as well as the strong infrared excess, implying an intense mass-loss, can be understood if we postulate that the progenitor was a common-envelope binary being in the so-called spiral-in phase. This phase ended in 2002 when the cores of the binary components entered a violant merger phase, which resulted in the observed eruption. Copious dust-condensation in matter outflowing from the merging binary finally hiddened the object, so it became invisible in the optical. After a certain time, when dust partly disperses in space, we will perhaps have a chance to see the central star radiation scattered on denser dusty regions. The radiation would also populate low-lying excitation levels of atoms and molecules in these regions. Thus it is possible that, in a certain future, the object reappears in the optical with a spectrum resembling that of the V4332 Sgr remnant (Kamiński et al. 2010).
Avaible at http://www.ast.uct.ac.za/~jarrett/irac/tools
Images were retrieved using the service available at http://www.cai-mama.obspm.fr/mama/
Acknowledgments
The OGLE project has received funding from the European Research Council under the European Community’s Seventh Framework Programme (FP7/2007−2013)/ERC grant agreement No. 246678. The research reported in this paper has partly been supported by a grant No. N N203 403939 financed by the Polish Ministry of Sciences and Higher Education. We thank Marcin Hajduk for participating in photometric measurements of the K-band images obtained at CTIO on 24/25 October 2003 (Sect. 5.2) and the digitailsed plate from the ESO Red Atlas obtained in August 1980 (Sect. 6). Thanks also to Richard Pogge for finding out the CTIO K-band observations of BLG-360 obtained in October 2003. This publication makes use of several data products: from the Two Micron All Sky Survey, which is a joint project of the University of Massachusetts and the Infrared Processing and Analysis Center/California Institute of Technology, funded by the National Aeronautics and Space Administration and the National Science Foundation; from the Midcourse Space Experiment (the MSX data funded by the Ballistic Missile Defense Organization with additional support from NASA Office of Space Science); from the NASA/ IPAC Infrared Science Archive, which is operated by the Jet Propulsion Laboratory, California Institute of Technology, under contract with the National Aeronautics and Space Administration (NASA); from the Spitzer Space Telescope, which is operated by the Jet Propulsion Laboratory, California Institute of Technology under a contract with NASA; from the Wide-field Infrared Survey Explorer, which is a joint project of the University of California, Los Angeles, and the Jet Propulsion Laboratory/California Institute of Technology, funded by NASA. from the Cambridge Astronomical Survey Unit; and data collected at the Paranal Observatory under ESO programme ID 179.B-2002. We acknowledge all these institutions.
References
- Alcock, C., Axelrod, T. S., Bennett, D. P., et al. 2002, in Robotic Telescopes in the 1990s, ASP Conf. Ser., 34, 193 [Google Scholar]
- Berger, E., Soderberg, A. M., Chevalier, R. A., et al. 2009, ApJ, 699, 1850 [NASA ADS] [CrossRef] [Google Scholar]
- Bond, I. A., Abe, F., Dodd, R. J., et al. 2001, MNRAS, 327, 868 [NASA ADS] [CrossRef] [Google Scholar]
- Bond, H. E., Henden, A., Levay, Z. G., et al. 2003, Nature, 422, 405 [NASA ADS] [CrossRef] [PubMed] [Google Scholar]
- Bond, H. E., Bedin, L. R., Bonanos, A. Z., et al. 2009, ApJ, 695, L154 [NASA ADS] [CrossRef] [Google Scholar]
- Crause, L. A., Lawson, W. A., Kilkenny, D., et al. 2003, MNRAS, 341, 785 [NASA ADS] [CrossRef] [Google Scholar]
- Drilling, J. S., & Landolt A. U. 2000, in Allen’s Astrophysical Quantities, ed. A. N. Cox (Springer-Verlag), 381 [Google Scholar]
- Egan, M. P., Price, S. D., & Kraemer, K. E. 2003, BAAS, 35, 1301 [NASA ADS] [Google Scholar]
- Evans, A, van Loon, J. Th, Zijlstra, A. A., et al. 2002, MNRAS, 332, L35 [NASA ADS] [CrossRef] [MathSciNet] [Google Scholar]
- Górny, S. K., Chiappini, C., Stasińska, G., & Cuisinier, F. 2009, A&A, 500, 1089 [NASA ADS] [CrossRef] [EDP Sciences] [Google Scholar]
- Humphreys, R. M., Bond, H. E., Bedin, L. R., et al. 2011, ApJ, 743, 118 [NASA ADS] [CrossRef] [Google Scholar]
- Ishihara, D., Onaka, T., Kataza, H., et al. 2010, A&A, 514, A1 [NASA ADS] [CrossRef] [EDP Sciences] [Google Scholar]
- Ivanova, N., Justham, S., Chen, X., et al. 2013, A&AR, 21, 59 [Google Scholar]
- Kamiński, T., Schmidt, M., & Tylenda, R. 2010, A&A, 522, A75 [NASA ADS] [CrossRef] [EDP Sciences] [Google Scholar]
- Kashi, A., & Soker, N. 2013, ApJ, 764, L6 [NASA ADS] [CrossRef] [Google Scholar]
- Kashi, A., Frankowski, A., & Soker, N. 2010, ApJ, 709, L11 [NASA ADS] [CrossRef] [Google Scholar]
- Kato, T., 2003, A&A, 399, 695 [NASA ADS] [CrossRef] [EDP Sciences] [Google Scholar]
- Kochanek, C. S. 2011, ApJ, 741, 37 [NASA ADS] [CrossRef] [Google Scholar]
- Kulkarni, S. R., Ofek, E. O., Rau, A., et al. 2007, Nature, 447, 458 [Google Scholar]
- Martini, P., Wagner, R. M., Tomaney, A., et al. 1999, AJ, 118, 1034 [NASA ADS] [CrossRef] [Google Scholar]
- Mason, E., Diaz, M., Williams, R. E., Preston, G., & Bensby, T. 2010 A&A, 516, A108 [NASA ADS] [CrossRef] [EDP Sciences] [Google Scholar]
- Minniti, D., Lucas, P. W., Emerson, J. P., et al. 2010, New Astron., 15, 433 [NASA ADS] [CrossRef] [Google Scholar]
- Mould, J., Cohen, J., Graham, J. R., et al. 1990, ApJ, 353, L35 [NASA ADS] [CrossRef] [EDP Sciences] [Google Scholar]
- Munari, U., Henden, A., Kiyota, S., et al. 2002, A&A, 389, L51 [NASA ADS] [CrossRef] [EDP Sciences] [Google Scholar]
- Nataf, D. M., Gould, A., Fouqué, P., et al. 2013, ApJ, 769, 88 [NASA ADS] [CrossRef] [Google Scholar]
- Nicholls, C. P., Melis, C., Soszyński, I., et al. 2013, MNRAS, 431, L33 [NASA ADS] [CrossRef] [Google Scholar]
- Paczyński, B. 2003, unpublished [arXiv:astro-ph/0306564] [Google Scholar]
- Prieto, J. L. 2008, ATel, 1550 [Google Scholar]
- Prieto, J. L., Sellgren, K. T., Todd, A., & Kochanek, Ch. S. 2009, ApJ, 705, 1425 [NASA ADS] [CrossRef] [Google Scholar]
- Prieto, J. L, Rigby, J. R., Scowcroft, V., et al. 2010, ATel, 2406 [Google Scholar]
- Schmidt-Kaler, Th. 1982, in The Physical Parameters of the Stars, ed. K.-H. Hellwege, Landolt-Börnstein, New Series, VI/2b (Springer-Verlag) [Google Scholar]
- Schuster, H. E. 1980, The Messenger, 22, 7 [NASA ADS] [Google Scholar]
- Shara, M. M., Moffat, A. F. J., & Webbink, R. F. 1985, ApJ, 294, 271 [NASA ADS] [CrossRef] [Google Scholar]
- Skrutskie, M. F., Cutri, R. M., Stiening, R., et al. 2006, AJ, 131, 1163 [NASA ADS] [CrossRef] [Google Scholar]
- Smith, N., Ganeshalingam, M., Chornock, R., et al. 2009, ApJ, 697, L49 [NASA ADS] [CrossRef] [Google Scholar]
- Smith, N., Li, W., Silverman, J. M., Ganeshalingam, M., & Filippenko, A. V. 2011, MNRAS, 425, 773 [NASA ADS] [CrossRef] [Google Scholar]
- Soker, N., & Tylenda, R. 2003, ApJ, 582, L105 [NASA ADS] [CrossRef] [Google Scholar]
- Tylenda, R. 2005, A&A, 436, 1009 [NASA ADS] [CrossRef] [EDP Sciences] [Google Scholar]
- Tylenda, R., & Soker, N. 2006, A&A, 451, 223 [NASA ADS] [CrossRef] [EDP Sciences] [Google Scholar]
- Tylenda, R., Acker, A., Stenholm, B., & Köppen, J. 1992, A&AS, 95, 337 [NASA ADS] [Google Scholar]
- Tylenda, R., Soker, N., & Szczerba, R. 2005, A&A, 441, 1099 [NASA ADS] [CrossRef] [EDP Sciences] [Google Scholar]
- Tylenda, R., Hajduk, M., Kamiński, T., et al. 2011a, A&A, 528, A114 [Google Scholar]
- Tylenda, R., Kamiński, T., Schmidt, M., et al. 2011b, A&A, 532, A138 [NASA ADS] [CrossRef] [EDP Sciences] [Google Scholar]
- Udalski, A. 2003, Acta Astron., 53, 291 [NASA ADS] [Google Scholar]
- Udalski, A., Szymański, M. K., Soszyński, I., & Poleski, R. 2008, Acta Astron., 58, 69 [NASA ADS] [Google Scholar]
- Wright, E. L., Eisenhardt, P. R. M., Mainzer, A. K., et al. 2010, AJ, 140, 1868 [NASA ADS] [CrossRef] [Google Scholar]
Appendix A: OGLE-2002-BLG-360 in the archives of the MOA project
OGLE-2002-BLG-360 was monitored in the MOA (Microlensing Observations in Astrophysics) project during the time period of 2000−2005. In the archives of MOA the object is named as MOA-2003-BLG-86. The observations were made with the wide red MOA filter and the data are available as counts relative to a reference flux. Using Eq. (7) (for CCD 1) in Bond et al. (2001) the data can be transformed into magnitudes in the Ic passband. The results are presented in Fig. A.1 as full points. For comparison the I magnitides from OGLE-III are also shown in the figure as open circles.
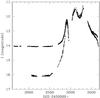 |
Fig. A.1 I magnitudes of BLG-360 as obtained from the MOA archives (full points) compared to the data from OGLE-III (open circles). |
As can be seen from Fig. A.1, the agreement of the MOA results near the maxima of the eruption is reasonable. However, before the eruption and in the rising phase the data disagree. The MOA data gives a brightness of the progenitor at a level of I ≃ 14.05, while in the OGLE data the object is ~2 mag fainter. In the MOA data the initial rise is much slower and the amplitude of the eruption is significantly smaller than in OGLE.
We analysed this disagreement in different ways and we conclude that the reason probably lies in a wrong value of the reference flux in the MOA archive data. We adjusted the reference flux as to get a good agreement between MOA and OGLE in the progenitor phase (see Fig. 8). The results are presented in Fig. A.2. The general agreement of the light curves is now very good. Small systematic differences can be understood in terms of differences in the filters and the evolution of the colour of BLG-360. The red filter of MOA is more sensitive to shorter wavelengths than the I filter of OGLE. As can be seen from Fig. 2, in the rising phase in 2003, the V − I colour was slightly bluer than that of the progenitor. This is consistent with the MOA magnitude beeing then slightly but systematicaly brighter than the OGLE value. On the other hand, the strong and systematic reddening of the object in the V − I colour during the eruption explains while during the 2004 maxima and the 2005 decline the object becomes systematically fainter in MOA than in OGLE.
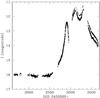 |
Fig. A.2 Same as in Fig. A.1 but with a modified reference flux in the MOA data, as explained in the text. |
The point is, however, that in order to get the agreement between MOA and OGLE, as shown in Fig. A.2, we had to decrease the reference flux in the MOA data by 85%. It is not clear, how to explain this factor. The angular resolution of the MOA images was typically 2.5 arcsec (Bond et al. 2001), which is significantly worse than that of OGLE-III (0.7−1.0 arcsec). Hence in a dense field measurements with MOA could have included more light from field stars compared to OGLE. Indeed the I OGLE-III images show that there are stars within 1−2 arcsec from BLG-360 but they are faint, significantly fainter that the progenitor of BLG-360. Thus they cannot explain why the progenitor was measured in MOA a factor of 6 brighter than in OGLE. Unless one of the nearby field stars seen in the OGLE images is a source of a strong Hα emission, which would be measured in the red MOA filter but not in the I OGLE filter. This possibility is, however, unlikely. Finally, note that measurements of the BLG-360 progenitor made with the red filter in the MACHO project (see Appendix B) gave values significantly fainter than the I values of OGLE, as expected. This further strengthens our conclusion that the reference flux given in the archive MOA data is wrong, i.e. significantly too high.
Appendix B: OGLE-2002-BLG-360 in the archives of the MACHO project
A field including the position of OGLE-2002-BLG-360 was monitored in the MACHO project (Alcock et al. 2002) in 1995−99. The observations were obtained with the blue and red filters of MACHO. Measurements from the blue filter images show a large scatter in the range of 19−20 mag and are most probably strongly affected by scattered light from nearby field stars. We therefore analyse the results of the red filter observations alone, which are shown in Fig. B.1.
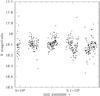 |
Fig. B.1 Results of measurements of the BLG-360 progenitor in 1995−99 extracted from the MACHO archives. The observations were made with the MACHO red filter. |
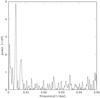 |
Fig. B.2 Power spectrum of photometric variations of the BLG-360 progenitor in 1995−99 derived from the MACHO red filter measurements. |
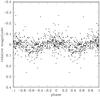 |
Fig. B.3 Photometric mesurements of the progenitor of BLG-360 in 1995−99 folded with a period of 240 days, which corresponds to the highest peak in the power spectrum presented in Fig. B.2. |
As can be see from Fig. B.1, five years of monitoring the progenitor of BLG-360 do not show any significant long term evolution of the object. The results oscillate around a mean value of ~18.1 mag. Most of this fluctuations are probably of instrumental origin and contamination from light of nearby field stars. One can, however, notice ~0.1 mag variations of the object on a time scale of months. We performed a periodogram analysis of the data. A power spectrum of the variations is shown in Fig. B.2. As can be seen from the figure, the most significant peak in the power spectrum corresponds to a period of ~240 days (for frequences higher than those shown in the figure the power spectrum shows only peaks corresponding to one day and its harmonics). The obtained power of this peak corresponds to an amplitude of 0.022 mag. The observational data folded with a period of 240 days are shown in Fig. B.3.
All Tables
All Figures
|
Fig. 1 Light curve of OGLE-2002-BLG-360 from the OGLE-III project: I Kron-Cousins magnitude versus time of observations in Julian Dates. Time in years is marked on top of the figure. |
| In the text | |
|
Fig. 2 Evolution of the V − I colour of OGLE-2002-BLG-360 – open symbols. The I curve of the object is also shown with small dots. |
| In the text | |
|
Fig. 3 I light curve of OGLE-2002-BLG-360 during its rise to the first maximum. The line shows an exponential fit using the same formula as in Tylenda et al. (2011a, their Eq. (2)) in their analysis of the rise of V1309 Sco. |
| In the text | |
|
Fig. 4 Spectral energy distribution of the progenitor of BLG-360. Symbols: observational data from OGLE-III, 2MASS, and MSX, as well as upper limits from IRAS (see text for more details). Vertical error bars: estimated uncertainties of the measurements. Horizontal error bars: photometric band widths used in the observations. Full curve: model spectrum obtained with the values of the model parameters listed in the first row of Table 1. Dashed curves: individual contributions of the star and the dusty envelope. |
| In the text | |
|
Fig. 5 Spectral energy distribution of BLG-360 on 24/25 October 2003. Full symbols: measurements from OGLE (V and I) and CTIO (K) (see text for more details). Curves: model SED obtained with the parameters listed in the second row of Table 1. |
| In the text | |
|
Fig. 6 Spectral energy distribution of BLG-360 in May 2006−August 2007. Symbols: V upper limit and I measurement (asterisk) from OGLE, Spitzer IRAC and MIPS measurements (full circles), as well as the AKARI measurement (open circle). See text for more details. Curves: model results obtained with the parameters listed in the third row of Table 1. |
| In the text | |
|
Fig. 7 Spectral energy distribution of the remnant of BLG-360 in 2010. Full symbols: measurements from the VVV (H and KS) and WISE surveys in March−September 2010. Full curve: an optically thick dust model with Tdust = 550 K. |
| In the text | |
|
Fig. 8 Evolution of the I brightness of BLG-360 in 2000−2002 as obtained from the MOA archives (open circles) and the OGLE-III data (full points). Note that the reference flux in the MOA data was modified, as explained in Appendix A. |
| In the text | |
|
Fig. 9 Visual light curve of CK Vul (Nova Vul 1670) compared to the I curve of BLG-360. Full symbols: eye estimates of CK Vul in 1670−1672 (the data are from Shara et al. 1985, arrows: upper limits). Small dots: I measurements of BLG-360 in 2003−2005. Notes: the BLG-360 light curve is shifted in the magnitude scale to match the brightness of CK Vul, the time scale of BLG-360 is increased by a factor of 1.4. |
| In the text | |
|
Fig. A.1 I magnitudes of BLG-360 as obtained from the MOA archives (full points) compared to the data from OGLE-III (open circles). |
| In the text | |
|
Fig. A.2 Same as in Fig. A.1 but with a modified reference flux in the MOA data, as explained in the text. |
| In the text | |
|
Fig. B.1 Results of measurements of the BLG-360 progenitor in 1995−99 extracted from the MACHO archives. The observations were made with the MACHO red filter. |
| In the text | |
|
Fig. B.2 Power spectrum of photometric variations of the BLG-360 progenitor in 1995−99 derived from the MACHO red filter measurements. |
| In the text | |
|
Fig. B.3 Photometric mesurements of the progenitor of BLG-360 in 1995−99 folded with a period of 240 days, which corresponds to the highest peak in the power spectrum presented in Fig. B.2. |
| In the text | |
Current usage metrics show cumulative count of Article Views (full-text article views including HTML views, PDF and ePub downloads, according to the available data) and Abstracts Views on Vision4Press platform.
Data correspond to usage on the plateform after 2015. The current usage metrics is available 48-96 hours after online publication and is updated daily on week days.
Initial download of the metrics may take a while.