| Issue |
A&A
Volume 555, July 2013
|
|
|---|---|---|
| Article Number | A128 | |
| Number of page(s) | 11 | |
| Section | Extragalactic astronomy | |
| DOI | https://doi.org/10.1051/0004-6361/201321487 | |
| Published online | 12 July 2013 | |
Cold dust in the giant barred galaxy NGC 1365
1 Max-Planck-Institut für Astronomie, Königstuhl 17, 69117 Heidelberg, Germany
e-mail: taba@mpia.de
2 Max-Planck Institut für Radioastronomie, Auf dem Hügel 69, 53121 Bonn, Germany
3 Observatoire de Paris, LERMA, CNRS, 61 Av. de l’Observatoire, 75014 Paris, France
4 Astron. Dept., King Abdulaziz University, PO Box 80203, Jeddah, Saudi Arabia
5 University of Minnesota, 116 Church St SE, Minneapolis, MN 55414, USA
6 California Institute of Technology 301-17, 1200 E. California Blvd, Pasadena, CA 91125, USA
Received: 15 March 2013
Accepted: 7 May 2013
Constraining the physcial properties of dust requires observations at submm wavelengths. This will provide important insight into the gas content of galaxies. We mapped NGC 1365 at 870 μm with LABOCA, the Large APEX Bolometer Camera, allowing us to probe the central mass concentration as well as the rate at which the gas flows to the center. We obtained the dust physical properties both globally and locally for different locations in the galaxy. A 20 K modified black body represents about 98% of the total dust content of the galaxy, the rest can be represented by a warmer dust component of 40 K. The bar exhibits an east-west asymmetry in the dust distribution: The eastern bar is heavier than the western bar by more than a factor of 4. Integrating the dust spectral energy distribution, we derived a total infrared luminosity, LTIR, of 9.8 × 10¹⁰ L⊙, leading to a dust-enshrouded star formation rate of SFRTIR ≃ 16.7 M⊙ yr-1 in NGC 1365. We derived the gas mass from the measurements of the dust emission, resulting in a CO-to-H2 conversion factor of XCO ≃ 1.2 × 10²⁰ mol cm-2 (K km s-1)-1 in the central disk, including the bar. Taking into account the metallicity variation, the central gas mass concentration is only ≃20% at R < 40″ (3.6 kpc). On the other hand, the timescale on which the gas flows into the center, ≃300 Myr, is relatively short. This indicates that the current central mass in NGC 1365 is evolving fast because of the strong bar.
Key words: galaxies: individual: NGC 1365 / galaxies: ISM / submillimeter: ISM / galaxies: star formation
© ESO, 2013
1. Introduction
Bars are generally considered as an important transform mechanism of molecular gas toward the central regions of galaxies, fueling central starbursts and active nuclei. This is confirmed by an enhancement of CO emission along the bar (e.g. Gerin et al. 1988; Benedict et al. 1996; Sakamoto et al. 1999a) and by the resolved offset ridges along the leading edges of the rotating bar (Ishizuki et al. 1990). However, key questions about the formation and evolution of bars and the influence of bars on the physical and chemical evolution of the interstellar medium (ISM) remain open. Numerical simulations suggest that barred galaxies tend to have more of their gas mass concentrated in their centers than nonbarred galaxies (e.g. Combes & Gerin 1985). This is tentatively confirmed by 12CO(J = 1–0) observations (Sakamoto et al. 1999b). However, the observational evidence to date is sparse, and has its shortcomings. On the other hand, it is possible that the central mass concentration is affected by more than just the presence of bars. For example, Komugi et al. (2008) showed that the Hubble type could play a more important role than bars. As such, the distribution of gas contained in the disk of barred galaxies could shed light on the question.
Although CO observations directly probe the gas in its molecular phase (H2), there are indications that bars can contain gravitationally unbound molecular gas (e.g. Das & Jog 1995; Hüttemeister et al. 2000). Thus, in barred environments the mass of the molecular gas might be overestimated since the standard Galactic CO to H2 mass factor XCO (the virial X-conversion factor) is not necessarily applicable. Moreover, the dependence of the XCO conversion factor on the metallicity (Wilson 1995) and the optical thickness of the CO line introduce an uncertainty on the estimate of the total gas mass in general.
As an alternative method of measuring the gas mass, observations of the dust continuum emission have been suggested and used by several authors (e.g. Hildebrand 1983; Guelin et al. 1993; James et al. 2002). Furthermore, studies based on the γ-ray observations of the Milky Way with the EGRET (Grenier et al. 2005) and Fermi (Abdo et al. 2010) space telescopes indicate that dust is a promising tracer of the gas, even of gas invisible in HI and CO (the so-called dark gas). Detailed studies of the mm and submm continuum emission from the Milky Way and other nearby galaxies show that about 90% of the dust mass is as cold as 14–16 K, and that dust is well-mixed with molecular gas so that cold dust emission can be used to probe the molecular hydrogen (e.g. Misiriotis et al. 2006). The cold dust can be best studied at submm wavelengths. Moreover, the importance of the submm data in constraining the dust spectral energy distribution (SED) and extracting dust mass and temperature has previously been indicated in numerous studies (e.g. Gordon et al. 2010). Therefore, submm observations of barred galaxies are important for studying the physics of the dominant component of the ISM in both disks and bars.
The total infrared emission (integrated in the wavelength range from, e.g., 8 to 1000 μm) is known to be a good tracer of the embedded star formation in galaxies (see Kennicutt & Evans 2012, and references therein). Nevertheless, it is still not clear how much of this emission is linked to dust heating sources other than the ongoing star formation, e.g., to non-ionizing UV photons or old stellar population.
We investigate the central mass concentration and the physical properties of the cold dust in the great barred spiral galaxy NGC 1365. With a diameter of twice that of the Milky Way (~60 kpc) and a mild inclination (~41°), NGC 1365 is among the best-studied barred galaxies from the X-ray to the radio regimes, providing a rich multi-wavelength data archive ideal for in-depth studies. This galaxy hosts a Seyfert 1.5 (Schulz et al. 1999) as well as strong star formation activity (starburst) in the center (e.g. see Lindblad 1999, and references therein). NGC 1365 has a nuclear bar of about one kpc embedded in the large-scale bar (Jungwiert et al. 1997). This galaxy does not host a circumnuclear ring, in contrast to many barred galaxies. The shape of the central starburst region is asymmetric, with two massive dust lanes, with strong and aligned magnetic fields (Beck et al. 2005). NGC 1365 has been observed with the 1.8-m Balloon-borne Large Aperture Submm Telescope (BLAST) at 250, 350, and 500 μm at resolutions 36′′, 42′′, and 60′′, respectively (Wiebe et al. 2009). At these wavelengths, the central part of the galaxy has also been observed with the Herschel Space Observatory (Alonso-Herrero et al. 2012). Here, we present submm observations of this galaxy at 870 μm with the APEX bolometer camera (LABOCA) at a resolution of about 20′′, which is much higher than that of the BLAST and Herschel submm data at 500 μm.
Through a comparison with various tracers of the ISM, we study the energy sources of the 870 μm emission. We also re-visit the dust physical properties such as temperature, mass, and total infra-red luminosity LTIR and use this information to estimate the XCO conversion factor as well as the star formation rate in NGC 1365. In a different approach, we also present the dust physical properties along the bar using the LABOCA 870 μm and the BLAST 250 μm data in apertures of 36′′. The 870 μm data are also used as a constraint for a gas flow model in this barred system.
The paper is organized as follows. The 870 μm observations and data reduction as well as the relevant auxiliary data sets used are described in Sect. 2. We investigate the morphology and origin of the 870 μm emission and derive the dust physical parameters in Sect. 3. Based on these results, the gas mass concentration and the role of XCO conversion factor are discussed in Sect. 4. We also update estimates of the star formation rate as well as the rate of the gas flow in the center. The final results are then summarized in Sect. 5.
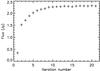 |
Fig. 1 Integrated flux density obtained after each iteration in the data reduction. The convergance is reached after the tenth iteration. |
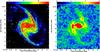 |
Fig. 2 Left: submm 870 μm emission (contours) superimposed on an optical image (B-band, taken from the STScI Digitized Sky Survey) of NGC 1365. The contour levels are 6, 9, 15, 24, 150, and 500 mJy/beam. The bar shows the optical surface brightness in arbitrary units. Right: submm 870 μm emission, normalized to the one σ noise rms level (signal-to-noise ratio). The angular resolution of 23″ is shown in the lower left corner. |
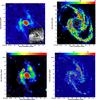 |
Fig. 3 Top left: LABOCA 870 μm emission compared with CO(2-1) observations of the central part of NGC 1365 (contours on top of an optical image, see Sandqvist et al. 1995). Top right: contours of the 870 μm emission overlaid on the HI map. Bottom left: the same contours on top of the radio continuum emission at 6 cm and the GALEX FUV map (bottom right). In all panels the resolution of the 870 μm emission is 23″ with contour levels of 6, 9, 15, 24, 150, and 500 mJy/beam. |
Positional data adopted for NGC 1365.
2. Data
2.1. Sub-mm observations and data reduction
The 870 μm data were taken with the Large APEX BOlometer Camera (LABOCA Siringo et al. 2009), a 295-pixel bolometer array, operated on the Atacama Pathfinder EXperiment 12-m diameter telescope (Güsten et al. 2006) in Chanjantor, Chile. We observed NGC 1365 in 2008 December and 2009 August in mostly good weather conditions (the precipitable water vapour PWV content ranged from 0.1 mm to 0.9 mm). NGC 1365 was mapped in the spiral raster mode, providing a fully sampled map in the LABOCA field of view (11′ × 11′) in each scan. The total on-source integration time was about 12 h. The data were calibrated by observing Mars and Uranus together with the secondary calibrators and was found to be accurate within 15%. The data were reduced using the BOA (BOlometer array Analysis) software (Siringo et al. 2009; Schuller et al. 2009). After flagging for bad and noisy pixels, the data were despiked and correlated noise was removed for each scan. Then the scans were coadded (weighted by rms-2) to create the final map.
This process was performed 21 times in an iterative approach following Belloche et al. (2011). After a first iteration of the reduction, we made a source model by setting the map to zero below a signal-to noise ratio of 4. Then the source map was used to flag bright sources and the data were reduced again. After the fourth iteration, the map resulting from the previous iteration was set to zero below a signal-to-noise ratio of 2.5. The remaining signal was subtracted from the data before reduction and added back after reduction. This way, negative artifacts that appear around the bright sources are much reduced, more extended emission can be recovered, and a more stable background noise level in the central region is obtained. Figure 1 shows a fast increase in the integrated flux density from the first to the fifth iteration, reaching a stable situation after the tenth iteration.
The HPBW of the telescope at 870 μm is 19.2″. The map was convolved to 23″ to achieve a better signal-to-noise ratio without loosing too much spatial information about the emission properties. Figure 2 shows the convolved map with an rms noise of 3 mJy/beam.
2.2. Complementary data
This study is supplemented with other tracers of the neutral and ionized gas. Table 2 summarizes the data used in this work. Jorsater & van Moorsel (1995) mapped NGC 1365 in 21-cm HI line emission with the VLA using hybrid BnA, CnB, and DnC configurations at a resolution of 11.6″ × 6.3″ (Fig. 3). This dataset has been corrected for missing spacings. NGC 1365 was observed in 12CO(1–0) over a 204″ × 164″ region centered on the nucleus with the Swedish/ESO Submillimeter Telescope (SEST) by Sandqvist et al. (1995) at a resolution of 44′′. To subtract its contribution in the LABOCA band, the SEST observations of the 12CO(3–2) line (Sandqvist 1999) were used as well.
NGC 1365 data used in this study.
Wiebe et al. (2009) presented the BLAST observations of NGC 1365 at 250, 350, and 500 μm at resolutions 36″, 42″, and 60″, respectively. We used their maps clipped in an area of 13′ × 13′ centered on the nucleus. Moreover, the far-infrared (FIR) measurements of ISOPHOT (Spinoglio et al. 2002) and ISO-LWS (Brauher et al. 2008) made with the Infrared Space Observatory (ISO) as well as with the Infrared Astronomical Satellite (IRAS; Sanders et al. 2003) have been used to study the dust SED.
The radio continuum emission from NGC 1365 was mapped with VLA at 6.2 cm and at 13′′ resolution (Beck et al. 2005). The radio 6.2 cm emission is mainly emerging from the central 300″ × 300″ region. We used the 6.2 cm map after subtracting the bright background radio source in the northeast of the galaxy. In the far-ultraviolet (FUV), NGC 1365 was observed with the GALaxy Evolution EXplorer satellite (GALEX) at 4.5′′ resolution as detailed in the GALEX ultraviolet atlas of nearby galaxies (Gil de Paz et al. 2007).
3. Results
3.1. Morphology of the 870 μm continuum map
NGC 1365 is illuminated by its oval-shaped core of ~80″ diameter at 870 μm (Fig. 2). In this region, the 870 μm intensities are higher than 100 mJy/beam with a maximum of ~600 mJy/beam. The bar is brighter in the eastern edge than in the western edge. The two main spiral arms appear pronounced by bright clumps corresponding to the complexes of star-forming regions followed by faint emission (~3σ) in the outer parts. A segment of the secondary arm in the south-east of the galaxy, which is weak in optical images but bright in HI, is detected at 870 μm as well (see the 870 μm contours overlaid on a HI map in Fig. 3). Apart from their similarity along the spiral arms, the 870 μm and the HI emission show a striking difference in the central part, including the nucleus and the bar: while this region is the brightest part at 870 μm, it is the darkest in HI. The central part is also the most dominant region in the CO(1–0) line emission as well as in the radio continuum emission (e.g. at 6 cm, Fig. 3). While, for instance, Ondrechen & van der Hulst (1989) found weak HI absorption in a limited velocity range, the virtually complete absence of HI toward the center of NGC 1365 and most of its bar is explained by the fact that almost all gas in these dense regions is in molecular form (and is traced by the strong CO emission). Generally, the 870 μm emission is very similar to the 6 cm radio continuum emission, particularly in the extent of the main arms and the east-west asymmetry of the bar. On the other hand, the radio continuum emission is very weak in the secondary arm in the south-east of the galaxy, which is bright at 870 μm (and HI). This must be a region of high gas density, but with only little star formation. In the 6 cm radio continuum map, the strong source in the northeast is a background radio source (Sandqvist et al. 1982). In the FUV, the core does not dominate the emission. The strong central 870 μm emission indicates a significant attenuation of the UV emission by dust emitting in the FIR/submm range.
The integrated flux density of the 870 μm emission in the plane of the galaxy (using parameters listed in Table 1) around the center out to a radius of 220′′ (20 kpc) is S = 2.3 ± 0.3 Jy. The integrated flux density in the core (R < 40″ or 3.6 kpc) is S = 1.1 ± 0.2 Jy, about half of the total value.
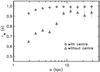 |
Fig. 4 Scale-by-scale correlation between the cold dust emission at 870 μm and the radio continuum emission at 6 cm from NGC 1365 before and after subtracting the central 80″ region. The cross-correlation coefficient rw(a) is higher on spatial scales a where correlations are tighter. |
3.2. Origin of the observed emission
Generally, the broad-band emission at 870 μm could consist of four main components: thermal dust emission, free-free emission from thermal electrons, synchrotron radiation from relativistic electrons, and contamination by CO(3–2) line emission. Because we are interested in the thermal dust emission alone, we have to investigate the contribution of the other components to the data.
The contribution of the CO(3–2) line emission to the surface brightness measured with the bolometer with a bandwidth of Δνbol and a beam width of Ωbeam can be calculated through  (1)where ICO(3 − 2) is the velocity-integrated main-beam brightness temperature (
 ) in K km s-1. Thus, Fline [mJy] = 0.973 ICO(3−2) [K km s-1] for the LABOCA bandwidth of 60 GHz and at 23′′ resolution. Using the SEST data, the contribution of the CO(3–2) line emission to the observed 870 μm continuum emission varies in the range 16%–25% in different locations. In the central 80′′ area, the CO(3–2) flux is ≃220 mJy, i.e., 20% of the observed 870 μm flux (S = 1.1 ± 0.2 Jy). The contribution of the CO(3–2) line emission was subtracted from the observed 870 μm emission before studying the dust physical properties.
In the core, where the contribution of the radio continuum emission has its maximum, the integrated flux density of the 6 cm radio continuum emission is ≃163 mJy. The thermal free-free fraction at 6 cm is about 20% (Beck et al. 2005). Since the free-free flux changes with wavelength as λ0.1, the corresponding thermal free-free flux at 870 μm is 21 mJy. Assuming a nonthermal spectral index of αn = 0.8, the contribution of the synchrotron emission (~λαn) is about 4 mJy. This is an upper limit, because the synchrotron spectrum is likely to steepen due to CRE energy losses. Thus, only 1–2% of the total 870 μm flux is contaminated by the free-free and synchrotron emission.
3.3. Heating sources of cold dust in NGC 1365
About 99% of the energy released by galaxies in the FIR and submm wavebands is produced by thermal emission from dust grains. However, the energy sources that heat the dust and power this emission are often uncertain. Any effective source of optical/ultraviolet (UV) radiation, either young massive stars or an accretion disk surrounding an AGN, would heat dust grains. Regions of intense dust emission are opaque at short wavelengths, and thus little information can be derived by optical or UV observations. As an extinction-free tracer of the ionized gas and star formation, the radio continuum emission can be used, instead, to probe the heating sources of dust. Such studies are most informative when performed locally and at resolved scales in galaxies. Global studies are possibly biased toward the brightest emitting components in a galaxy. For example, the well-known radio-FIR correlation is weighted by regions of massive star formation when studied globally and in galaxy samples (Tabatabaei et al. 2013). Only recently and through studying smaller scales within galaxies, variations of such tight correlations have become apparent (e.g. Hughes et al. 2006; Tabatabaei et al. 2007; Tabatabaei & Berkhuijsen 2010; Dumas et al. 2011).
We performed a scale-by-scale comparison of the 870 μm and the 6 cm radio continuum emission using a wavelet cross-correlation analysis. After convolving the 6 cm radio map to the resolution of the 870 μm map (23′′), the maps were normalized in grid size, reference coordinates, and field of view. The maps of the 870 μm and 6 cm emission were first decomposed into ten scales from 23′′ (~2 kpc) to about 300′′ (~27 kpc) using the Pet-Hat wavelet function as detailed in Frick et al. (2001), Tabatabaei et al. (2007), Laine et al. (2010), and Dumas et al. (2011). Then, we cross-correlated the resulting decomposed maps of the 870 μm and 6 cm emission at each of the ten spatial scales. In Fig. 4, the cross-correlation coefficients rw (for pure correlation or anti-correlation rw = ± 1) are plotted vs. the spatial scale a before and after subtracting the central 80′′. Before subtracting the core, the two emissions are perfectly correlated as rw > 0.9 on all scales. After the subtraction, however, the radio-submm correlation decreases particularly on scales a < 8 kpc. This shows that the good radio-submm correlation is mainly due to the core strongly emitting at both radio and submm wavelengths, under starburst conditions.
After subtracting the core, the situation resembles the radio-FIR correlation in normal star-forming galaxies, where the correlation decreases toward small scales (e.g. see Hughes et al. 2006; Dumas et al. 2011). The decreasing trend of the radio-FIR correlation could be attributed to different origins of the radio continuum emission and the dust emission. For instance, a weaker radio-FIR correlation is expected on small scales if the radio continuum emission is dominated by the synchrotron-radiating cosmic ray electrons (CREs) diffused on large scales along the interstellar magnetic field lines (Tabatabaei et al. 2013) or if the heating source of the dust is not linked to massive stars on small scales, but to a diffuse radiation field (ISRF). The latter is more likely the case for the cold dust emission traced at long FIR/submm wavelengths.
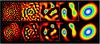 |
Fig. 5 Wavelet-decomposed maps at 870 μm (first row) and 6 cm (second row) on scales a ≃ 2, 3.5, 6.4, 8, and 29 kpc. |
Looking at the wavelet-decomposed maps (Fig. 5), the greatest difference in the morphologies is detected at the smallest scale (≃2 kpc). At this scale, the radio emission exhibits few point-like features as well as weaker filament-like structures following the spiral arms, while the cold dust emission shows dispersed clumpy structures. Such a non-coherent distribution is expected for diffuse emission, which fits to the dust heating scenario by a diffuse ISRF. We also note that strong noise could also provide a non-coherent morphology on small scales, reducing the correlation (Dumas et al. 2011). This, however, cannot be the entire reason of the observed decreasing trend in the radio-FIR correlation in galaxies, as the decreasing trend resists using more sensitive Herschel data (Tabatabaei et al. 2013). The morphologies of the radio and submm emission also differ significantly at scale of 3.5 kpc, becoming more similar toward larger scales. At a = 8 kpc, both radio and submm maps are similarly dominated by diffuse emission from star-forming complexes in the ridges and along the spiral arms, leading to a perfect radio-submm correlation at this scale (see Fig. 4).
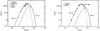 |
Fig. 6 Spectral energy distribution of NGC 1365 (left) and of the central 80″ (right). The colder component provides about 99% of the total dust content in the central part, and 98% in the entire area toward which 870 μm emission is detected. |
Dust temperature and mass surface densities for disk and core of NGC 1365.
3.4. Dust physical properties
We derived the dust mass and temperature assuming that dust grains are in local thermodynamic equilibrium (LTE) and hence emit as a modified black body (MBB). This condition applies for thermalized dust grains that usually emit at FIR and submm wavelengths (emission in the mid-IR, λ < 40 μm, is dominated by very small grains that are not thermalized). The dust SED derived based on the LABOCA and BLAST submm data together with the IRAS and the ISOPHOT FIR data can be best reproduced if a two-component MBB is used (Fig. 6): ![\begin{eqnarray} S_{\nu} &=& \Omega_{\rm s}\, [B_{\nu}(T_{\rm c}) (1 - {\rm e}^{-\tau_{\nu,{\rm c} }}) + B_{\nu}(T_{\rm w}) (1 - {\rm e}^{-\tau_{\nu,{\rm w} }})] , \end{eqnarray}](/articles/aa/full_html/2013/07/aa21487-13/aa21487-13-eq64.png) (2)where Sν is the FIR/submm flux, Bν the Planck function, ν the frequency, and Ωs the solid angle of the emitting area subtended to the observer. The two components, i.e., the cold and warm dust components , are specified by their temperatures Tc, Tw and mass surface densities Σc, Σw given by their optical depths τν,c and τν,w as
(2)where Sν is the FIR/submm flux, Bν the Planck function, ν the frequency, and Ωs the solid angle of the emitting area subtended to the observer. The two components, i.e., the cold and warm dust components , are specified by their temperatures Tc, Tw and mass surface densities Σc, Σw given by their optical depths τν,c and τν,w as
![\begin{eqnarray*} &&\Sigma_{\rm c} = \tau_{\nu, {\rm c}}/ \kappa_{\nu},\\[2mm] && \Sigma_{\rm w}= \tau_{\nu, {\rm w}}/ \kappa_{\nu}, \end{eqnarray*}](/articles/aa/full_html/2013/07/aa21487-13/aa21487-13-eq71.png)
where κν is the dust opacity or absorption coefficient. We adopted  in units of m2 per kilogram of a standard dust including silicates and amorphous carbon (Weiß et al. 2008; Krügel 2003, Chap. 14).
Using a standard χ2 minimization technique, the best-fitted MBB model to the observed SED results in a cold dust temperature Tc of 20 K and a warm dust temperature Tw of 40 K. The mass surface densities are about 0.1 M⊙ pc-2 and 1.6 × 10⁻³ M⊙ pc-2 for the cold and warm dust components, respectively. Thus, about 98% of the total dust content in this galaxy can be described with a temperature of 20 K. This model is equally well described by dust emissivity indices in the range β = 2.0 ± 0.1 (providing  ). This leads to a dust absorption coefficient at 870 μm of κ870 = 0.076 ± 0.002 m2 kg-1, which agrees with James et al. (2002).
We also derived the SED for the central 80″ area (core) for which the LABOCA submm data were used together with the BLAST data and the ISO long-wavelength spectrometer (LWS) data with a good coverage of the peak of the SED (Fig. 6b). In this region, the temperature of the cold and warm dust components are 26 K and 56 K, respectively (see Table 3). The best-fitted β in the core is the same as in the disk. The temperatures agree with those reported by Alonso-Herrero et al. (2012), who fitted the SED using the Herschel data.
We derived a total dust mass of Md ≃ 108 M⊙ for the entire galaxy taking into account only the points with intensities higher than 3σ at 870 μm. This agrees closely with Wiebe et al. (2009), taking into account the different absorption coefficients they used (κ870 ≃ 0.02 m2 kg-1). In the core, Md ≃ 2.9 × 10⁷ M⊙, constituting about 30% of the total dust mass in the galaxy.
In a second approach, we investigated the dust physical properties along the bar using the BLAST 250 μm-to-LABOCA 870 μm flux ratios in apertures of 36″ (the angular resolution of the BLAST 250 μm data). The color temperature can be derived using the following expression:  (3)where S250 and S870 denote the measured flux at 250 μm and 870 μm, respectively. We used β = 2 as derived based on the SED studies and that the dust is optically thin, which is valid at the wavelengths considered. The corresponding dust mass is then given by
  (4)Measurements of S250 and S870 in apertures shown in Fig. 7 lead to T and Md values listed in Table 4. Along the bar, T changes between 21 ± 3 K to 42 ± 5 K with errors determined based on calibration uncertainties of the integrated flux densities (~20% and 15% at 250 μm and 870 μm, respectively). The dust mass Md changes between (0.8 ± 0.2) × 106 M⊙ to (6.8 ± 1.8) × 106 M⊙ in the selected apertures along the bar. The dust temperature in apertures A and B (in the eastern bar) is similar to that of the spiral arms (e.g. aperture E) and also similar to that of the cold dust in the disk (≃20 K) obtained based on the SED analysis. On the other hand, the dust is warm in the western apertures C and D (the average equilibrium temperature in these two apertures is ≃40 K, the same as Tw for the disk). This together with the fact that the eastern bar is brighter than the western bar (Sect. 3.1) implies that the bar contains more dust in the east than in the west. Table 4 shows that the east/west ratio in Md amounts to more than a factor of 4.
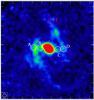 |
Fig. 7 Selected apertures with 36′′ diameter along the bar and northern spiral arm superimposed on the 870 μm map of NGC 1365. |
4. Discussion
4.1. Molecular gas mass and XCO conversion factor
The total dust mass determined from fitting to the SED of the disk (R ≤ 220″) leads to a total gas mass MG of 1.5 × 10¹⁰ M⊙ for a hydrogen gas-to-dust mass ratio of 150 (e.g. Krügel 2003; Young & Scoville 1991, and references therein). The total gas surface density (~17 M⊙ pc-2) is about three times higher than the local gas surface density in the Milky Way (~6 M⊙ pc-2, Dame 1993).
To compare the gas mass estimate from the dust mass with that derived from the existing HI and CO observations, the same integration area must be taken into account. Hence, we obtained the dust mass for the same restricted area for which CO data are available (204″ × 164″, Sandqvist et al. 1995). The integrated 870 μm flux, S870 ≃ 1.52 Jy, results in a dust mass of Md ≃ 7.12 × 10⁷ M⊙ using Eq. (4) for the 20 K dust. The corresponding total hydrogen gas mass is then MG = 1.07 × 10¹⁰ M⊙.
Integrating the HI map in the same area results in an HI flux of SHI = 2.1 × 10⁴ Jy m s-1. Using the calibration relation  with SHI in Jy km s-1 and D in Mpc (e.g. Jorsater & van Moorsel 1995), we obtain the HI mass of MHI = 1.72 × 10⁹ M⊙. Thus, the mass of the molecular gas is MH2 = MG − MHI = 8.95 × 10⁹ M⊙. This is about 48% lower (relative difference) than the H2 mass estimate using the CO data and assuming a CO-to-H2 conversion factor of XCO = 2.3 × 10²⁰ mol cm-2 (K km s-1)-1 (MH2 = 1.73 × 10¹⁰ M⊙, Sandqvist et al. 1995). The two MH2 estimates would be the same if a lower XCO of 1.2 × 10²⁰ mol cm-2 (K km s-1)-1 were used. We stress that this value, which is an upper limit derived using the lowest possible dust temperature and hence highest possible dust and gas mass, is lower than the default Galactic value of 2 × 10²⁰ mol cm-2 (K km s-1)-1.
For a similar comparison in the core, we first derived MH2 using the CO data and assuming a CO-to-H2 conversion factor of XCO = 2.3 × 10²⁰ mol cm-2 (K km s-1)-1 as used in Sandqvist et al. (1995). The intensity  of the CO(1–0) line averaged over the central 80′′ area, taking into account the SEST’s beam width of 44″ at 110 GHz is
  K km s-1. Following Sandqvist et al. (1995), MH2 = 3.7 × 10⁶ LCO with the CO luminosity given by
  (A is the integrated area in kpc2). Thus, the molecular gas mass in the bulge is MH2 = 6.28 × 10⁹ M⊙ using the CO data. On the other hand, based on the dust mass (see Table 3) and taking into account the HI mass, the molecular gas mass is MH2 = 4.33 × 10⁹ M⊙, implying an XCO conversion factor of 1.6 × 10²⁰ mol cm-2 (K km s-1)-1.
In the above estimate, it is assumed that the gas-to-dust ratio in the core is the same as for the disk. However, the gas-to-dust ratio or metallicity usually shows a radial gradient in galaxies (e.g. Muñoz-Mateos et al. 2009; Tabatabaei & Berkhuijsen 2010; Magrini et al. 2007; Smith et al. 2012). These variations should be considered to estimate the XCO conversion factor using the dust emission (FIR/submm) surveys across a galaxy (e.g. Cox et al. 1986). Based on optical observations of 53 HII regions, Pilyugin et al. (2004) obtained a radial gradient in metallicity or oxygen abundance in NGC 1365 as follows:  (5)Generally, the relative amount of dust and gas is expected to be correlated with the abundance of the heavy elements (e.g. Draine et al. 2007). Using a linear correlation between Z and the dust-to-gas mass ratio D (James et al. 2002), Eq. (5) leads to a gas-to-dust mass ratio of ≃117 in the core (assuming that it is 150 in the disk). This decreases the estimated molecular gas mass to MH2 = 3.36 × 10⁹ M⊙ and the conversion factor to XCO = 1.2 × 10²⁰ mol cm-2 (K km s-1)-1, which is the same as in the central disk (the 204″ × 164″ region).
On the other hand, it has been shown that Z and D could be correlated nonlinearly in galaxies (e.g. Issa et al. 1990; Schmidt & Boller 1993; Lisenfeld & Ferrara 1998). The correlation given by Schmidt & Boller (1993) agrees with that given by Issa et al. (1990) (which includes few large galaxies like the Milky Way, M31, M51, and M101) but has a better statistics. Schmidt & Boller (1993) found that Z is related to the logarithm of the dust-to-gas mass ratio D through Z ~ D0.63 ± 0.25. Assuming that the same proportionality applies in NGC 1365, we find a gas-to-dust mass ratio of ≃100 in the core, leading to a molecular gas mass of MH2 = 2.86 × 10⁹ M⊙ and a conversion factor of XCO = 1.0 × 10²⁰ mol cm-2 (K km s-1)-1. Therefore, the XCO conversion factor is lower in the core than in the central disk by 20%.
Taking into account the metallicity gradient, the central gas mass concentration defined as the ratio of the total gas mass in the core to that in the entire disk is Mcore/Mdisk ≃ 0.2.
4.2. Star formation rate
Integrating the modeled SED for 40 μm < λ < 1000 μm, the FIR luminosity is derived as LFIR = 8.33 × 10¹⁰ L⊙. Following the FIR definition by Rice et al. (1988), the obtained luminosity in the range 42.5 μm < λ < 122.5 μm is L42.5 − 122.5 = 5.46 × 10¹⁰ L⊙. This agrees with Rice et al. (1988), giving L42.5 − 122.5 = 5.49 × 10¹⁰ L⊙ considering the different distance they used. Using the SED-based luminosity in the range 40 μm < λ < 500 μm, L40 − 500 = 8.31 × 10¹⁰ L⊙ together with the FIR to total infrared luminosity TIR (8 μm < λ < 1000 μm) luminosity calibration given by Chary & Elbaz (2001) for a sample of luminous infrared galaxies (LIRGs) and starburst galaxies, we derive LTIR = 9.8 × 10¹⁰ L⊙ (in agreement with Sanders et al. 2003, giving LTIR ≃ 1011 L⊙).
Several authors have used the LTIR/LFUV ratio to measure the extinction (e.g. Calzetti 2001; Verley et al. 2009; Montalto et al. 2009). Here we calculated the extinction in the core and in the disk using this method. Calzetti (2001) and Calzetti et al. (2005) found the following relation between the visual extinction and LTIR/LFUV for starburst condition:  (6)with C = 1 for emission from diffuse ionized gas and C = 0.44 for emission from stars. Using the GALEX data, we derive LFUV = 1.02 × 10⁹ L⊙ for the corresponding region in the disk. Assuming that the extinction is mainly caused by emission from stars, AV ≃ 1.4 is obtained. This is equivalent to an FUV extinction AFUV ≃ 3.5, resulting in a de-reddened FUV luminosity of
  The star formation rate based on the FUV emission is given by
  with
with  in erg-1 s-1 Hz-1 (Kennicutt 1998). This leads to SFRFUV ≃ 7 M⊙ yr-1 for the disk of NGC 1365. On the other hand, assuming that the energy source of the TIR emission is provided by massive stars, the so-called dust-enshrouded star formation rate can be derived using the TIR luminosity following Kennicutt (1998),
  with LTIR in L⊙. The corresponding value for NGC 1365 is SFRTIR ≃ 16.7 M⊙ yr-1.
Table 5 shows similar calculations for the core (central 80′′). The extinction value agrees with Kristen et al. (1997), who derived AV ~ 2 − 2.5 by means of the Balmer-decrement-ratio method.
The molecular depletion timescale, defined as the molecular gas mass per star formation rate (MH2/SFRFUV), is about 1.2 Gyr in the central disk (the 204″ × 164″ area). However, in the core, it is ≃ 0.7 Gyr and 0.9 Gyr for the nonlinear and linear Z–D correlations, respectively. This is due to a more efficient star formation in the core than in the disk in NGC 1365.
Properties of the disk and core in NGC 1365.
4.3. Gas flow in the bar
The central gas mass concentration obtained in Sect. 4.1 is evolving fast due to the gas flow in the bar. The correlation between the cold dust emission and a sum of the atomic and molecular gas emission (Sect. 3.1) already shows that the cold dust is a proxy for the gas in the disk. This additionally motivated us to investigate the gas flow in the bar based on the submm data as a tracer of the total gas. The strongly barred galaxy NGC 1365 is expected to experience gravity torques exerted by the bar on the gas disk, which could efficiently drive the gas toward the center through a reduction in its angular momentum.
We quantified the gas inflow in NGC 1365 by averaging the action of gravitational forces on the gas at different radii following Combes & Sanders (1981) and e.g. García-Burillo et al. (2005). The gravitational forces were computed to derive the underlying gravitational potential. It was assumed that the total mass budget is dominated by the stellar contribution and that the effect of gas self-gravity can be neglected. As a proxy of the stellar mass distribution, we used the H-band (1.5 μm) image of the 2MASS data, which is only weakly affected by dust extinction or stellar population biases. After removing the foreground stars, the H-band image was deprojected (the position angle and inclination are listed in Table 1). The image was then resampled at 1.5′′ per pixel. The deprojected H-band image is superposed on the dust contours in Fig. 8, showing a very good correspondence. This indicates that the molecular gas is well-aligned along the bar and spiral arms in NGC 1365. However, a slight phase shift can be noticed. The dust is shifted to the leading side of the bar: in Fig. 8, the contours of the dust in the bar are lemon-shaped elongated ellipsoids, whose extremities are shifted to smaller position angles with respect to the red-color bar on both sides, i.e., north and south of the center.
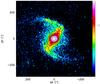 |
Fig. 8 Logarithmic contours of dust emission superposed on the near-infrared H image from 2MASS in logarithmic levels. Both images have been deprojected and rotated (50° counterclockwise) such that the major axis is horizontal. |
The deprojected H-band image was completed in the vertical dimension by assuming an isothermal plane model with a constant scale height, equal to ~1/12th of the radial scale-length of the image. The potential was then derived by a Fourier transform method, assuming a constant mass-to-light (M/L) ratio. The M/L value was selected to retrieve the observed rotation curve (given by Zánmar Sánchez et al. 2008, using Hα and HI data). Only a very light dark matter halo was added, of 3 × 10¹⁰ M⊙, to better fit the rotation curve in the outer parts. The axisymmetric part of the model, fitted by parametric functions, was then derived to find the proper frequencies, as shown in Fig. 9.
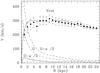 |
Fig. 9 Rotation curve and derived frequencies Ω, Ω − κ/2 and Ω + κ/2, for NGC 1365, obtained from the H-band image, and a constant M/L ratio. The model rotation curve has been fitted to the data points compiled from Hα and HI data (see Zanmar Sanchez et al. 2008). |
For the non-axisymmetric part, the potential Φ(R,θ) was then decomposed in the different m-modes,  where Φm(R) and φm(R) represent the amplitude and phase of the m-mode.
Following Combes & Sanders (1981), we defined the strength of the m-Fourier component, Qm(R), as  , i.e., by the ratio between tangential and radial forces. The strength of the total non-axisymmetric perturbation is defined by
  where
where  represents the maximum amplitude of the tangential force and F0(R) is the mean axisymmetric radial force. This quantity is a measure of the strength of the bar. The variation of phase φm with radius R distinguishes between bar and spiral arms. For example, the phase is constant for m = 2 in the bar-like potential, hence the extent of the bar can be deduced where φ2(R) = const. (see Fig. 10). A main bar can be seen clearly, together with two spiral arms, with small pitch angle.
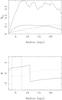 |
Fig. 10 Strengths (Q1, Q2, Q4 and total QT) and phases (φ1, φ2 and φ4) of the m = 1 (dash) m = 2 (full line) and m = 4 (dots) Fourier components of the stellar potential. The region of constant m = 2 phase delineates the extent of the bar (note the phase jumps by 2π/m). The φ-angles are measured from the + X axis in the counter-clockwise direction. |
After calculating the 2D force field per unit mass (Fx and Fy) from the derivatives of Φ(R,θ) on each pixel, the torques per unit mass were derived (t(x, y) = xFy − yFx). This torque field, by definition, is independent of the present gas distribution in the plane.
The next steps consist of using the torque field to derive the angular momentum variations and the associated flow timescales. We assume that the cold dust emission at each offset in the galaxy plane is a fair estimate of the probability of finding gas at this location at present. Hence, the gravitational torque map weighted by the gas surface density traced by the cold dust emission (t(x,y) × Σ(x,y), see Fig. 11) allows us to derive the net effect on the gas at each radius (the torque map is oriented according to the sense of rotation in the galactic plane).
To estimate the radial gas flow induced by the torques, we first computed the torque per unit mass averaged over the azimuth, using Σ(x,y) as the actual weighting function, i.e.,  By definition, t(R) represents the time derivative of the specific angular momentum L of the gas averaged azimuthally, i.e., t(R) = dL/dt | θ. To derive non-dimensional quantities, we normalized this variation of angular momentum per unit time to the angular momentum at this radius and to the rotation period. We then estimated the efficiency of the gas flow with the average fraction of the gas specific angular momentum transferred in one rotation (Trot) by the stellar potential, as a function of radius, i.e., by the function ΔL/L defined as
 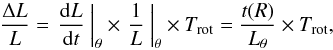 where Lθ is assumed to be well-represented by its axisymmetric estimate, i.e., Lθ = R × vrot. The ΔL/L radial distribution for NGC 1365 derived from the dust emission is displayed in Fig. 12.
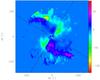 |
Fig. 11 Map of the gravitational torque (t(x,y) × Σ(x,y), as defined in text) in the center of NGC 1365. The derived torques change sign as expected, following a pattern of four quadrants. The orientation of quadrants follow the bar orientation in NGC 1365. In this deprojected picture, the major axis of the galaxy is oriented parallel to the horizontal axis. |
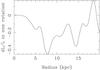 |
Fig. 12 Radial variation of the torque, or more precisely, the fraction of the angular momentum transferred from/to the gas in one rotation. |
Figure 11 shows that the derived torques change sign following a characteristic four-quadrant pattern. There is only one notable exception in the top quadrant of the diagram, where a patch of strong negative torque exists in the positive torque quadrant. These perturbations could be the consequence of infalling material, as noticed by Zánmar Sánchez et al. (2008). The gas location is mainly concentrated in the negative torque regions, as can be seen by comparison with Fig. 8, i.e., the majority of the gas in the bar is phase-shifted toward the leading edge, where the torques are negative. The rotation sense in the galaxy is clockwise, and the spiral structure is trailing.
These results can be explained according to the classical scenario of angular momentum transfer in barred galaxies. The main bar of ~11 kpc in radius ends slightly inside its co-rotation. This length obtained is longer than measurements using the I-band image of the galaxy (100″ ~ 9 kpc Zánmar Sánchez et al. 2008). From Fig. 9, it is deduced that the bar pattern speed is ~26 km/s/kpc. This value of the pattern speed indicates that there must be an inner Lindblad resonance (ILR) in the circum-nuclear region, which might correspond to the high gas concentration there, at r < 2 kpc. In the central region, the stellar kinematics suggest the presence of a nuclear disk, as shown by Emsellem et al. (2001).
The gas flow toward the center is taken just in the act in NGC 1365 at the present epoch. Figure 12 shows that at 7 kpc radius, about 45% of the angular momentum is removed in one orbit, so the radial flow timescale is 300 Myr. Hence, the flow rate is relatively high due to the strong bar. This leads to a high concentration of molecular gas toward the center, which must be recent, since the center does currently not host a strong starburst.
These results indicate that the galaxy’s AGN (Seyfert 1.5) is fueled by the present gas flow. However, it is not possible to conclude unambiguously whether the gas is stalled at the inner Lindblad resonance of the main bar or is still driven inward due to a nuclear bar, because of lack of spatial resolution.
There is a good correspondence between the regions of strongest (positive) torques (Fig. 11) and where ordered magnetic fields are strongest in NGC 1365 (Beck et al. 2005). This furthermore shows that ordered magnetic fields (traced by polarized radio emission) are signatures of non-axisymmetric gas flows and hence angular momentum transfer.
5. Summary
We produced the first large-scale map of the giant barred galaxy NGC 1365 at 870 μm using the Large APEX Bolometer Camera at 20′′ resolution. The submm map exhibits strong emission from the core and the bar, similar to molecular gas traced by CO emission, as well as the large-scale emission from the spiral arms, similar to HI emission. We investigated possible origins of this emission and performed a dust SED analysis, leading to estimates of the dust mass and total infrared luminosity. Assuming that the cold dust, presented by the submm emission, traces the total neutral gas in the galaxy, we also estimated the gas mass, the XCO conversion factor (taking into account the variation in metallicity), and the star formation rate in the disk and the core (central 80″) of NGC 1365. The most important findings of this study are summarized as follows:
-
The thermalized dust SED in NGC 1365 can bebest fitted by a two-component modified black-body model, withtemperatures of 20 K and 40 Kfor cold and warm dust, respectively. The cold dust representsabout 98% of the total dust content in this galaxy.
-
Comparing the gas mass obtained from the dust mass measurements with that based on the CO and HI observations, we derived an average CO-to-H2 conversion factor of XCO ≃ 1.2 × 10²⁰ mol cm-2 (K km s-1)-1 for the central disk (limited in a 204″ × 164″ area). This value is the same (20% higher than) in the core, taking into account the metallicity variation and assuming a linear (nonlinear) correlation between the gas-to-dust mass ratio and the metallicity.
-
The central gas mass concentration reduces from ~30% to about 20% taking into account metallicity variations.
-
Integrating the dust SED, the total IR luminosity is LTIR = 9.8 × 10¹⁰ L⊙, leading to a dust-enshrouded star formation rate of SFRTIR ≃ 16.7 M⊙ yr-1 in NGC 1365. The star formation efficiency is found to be higher in the core than in the disk by ≳50%.
-
The bar exhibits an east-west asymmetry in the 870 μm emission similar to that in the 6 cm radio continuum emission. This leads to an asymmetry in the distributions of the dust properties: The eastern bar is colder and heavier than the western bar by more than a factor of 4.
-
Apart from the similar distribution of the radio and submm emission along the bar and spiral arms, their correlation decreases by decreasing the spatial scale. This could indicate different origins of the cold dust emission (e.g., heating by a diffuse ISRF) and the radio continuum emission (e.g., CREs propagated along the magnetic fields) instead of massive star formation.
-
Based on the cold dust map, we deduced that the gas in NGC 1365 flows toward the center on a timescale of 300 Myr. About 45% of the angular momentum is removed in one orbit at 7 kpc radius.
Acknowledgments
We are grateful to Aa. Sandqvist for kindly providing us with the CO(3–2) data. We thank A. Belloche for useful discussions on LABOCA data reduction. F.S.T. acknowledges the support by the DFG via the grant TA 801/1-1.
References
- Abdo, A. A., Ackermann, M., Ajello, M., et al. 2010, ApJ, 710, 133 [NASA ADS] [CrossRef] [Google Scholar]
- Alonso-Herrero, A., Sánchez-Portal, M., Ramos Almeida, C., et al. 2012, MNRAS, 425, 311 [NASA ADS] [CrossRef] [Google Scholar]
- Beck, R., Fletcher, A., Shukurov, A., et al. 2005, A&A, 444, 739 [NASA ADS] [CrossRef] [EDP Sciences] [Google Scholar]
- Belloche, A., Schuller, F., Parise, B., et al. 2011, A&A, 527, A145 [NASA ADS] [CrossRef] [EDP Sciences] [Google Scholar]
- Benedict, F. G., Smith, B. J., & Kenney, J. D. P. 1996, AJ, 111, 1861 [NASA ADS] [CrossRef] [Google Scholar]
- Brauher, J. R., Dale, D. A., & Helou, G. 2008, ApJS, 178, 280 [NASA ADS] [CrossRef] [Google Scholar]
- Calzetti, D. 2001, PASP, 113, 1449 [NASA ADS] [CrossRef] [Google Scholar]
- Calzetti, D., Kennicutt, Jr., R. C., Bianchi, L., et al. 2005, ApJ, 633, 871 [NASA ADS] [CrossRef] [Google Scholar]
- Chary, R., & Elbaz, D. 2001, ApJ, 556, 562 [NASA ADS] [CrossRef] [Google Scholar]
- Combes, F., & Gerin, M. 1985, A&A, 150, 327 [NASA ADS] [Google Scholar]
- Combes, F., & Sanders, R. H. 1981, A&A, 96, 164 [NASA ADS] [Google Scholar]
- Cox, P., Kruegel, E., & Mezger, P. G. 1986, A&A, 155, 380 [NASA ADS] [Google Scholar]
- Dame, T. M. 1993, in Back to the Galaxy, eds. S. S. Holt, & F. Verter, AIP Conf. Ser., 278, 267 [Google Scholar]
- Das, M., & Jog, C. J. 1995, ApJ, 451, 167 [NASA ADS] [CrossRef] [Google Scholar]
- Draine, B. T., Dale, D. A., Bendo, G., et al. 2007, ApJ, 663, 866 [NASA ADS] [CrossRef] [Google Scholar]
- Dumas, G., Schinnerer, E., Tabatabaei, F. S., et al. 2011, AJ, 141, 41 [NASA ADS] [CrossRef] [Google Scholar]
- Emsellem, E., Greusard, D., Combes, F., et al. 2001, A&A, 368, 52 [NASA ADS] [CrossRef] [EDP Sciences] [Google Scholar]
- Frick, P., Beck, R., Berkhuijsen, E. M., & Patrickeyev, I. 2001, MNRAS, 327, 1145 [NASA ADS] [CrossRef] [Google Scholar]
- García-Burillo, S., Combes, F., Schinnerer, E., Boone, F., & Hunt, L. K. 2005, A&A, 441, 1011 [NASA ADS] [CrossRef] [EDP Sciences] [Google Scholar]
- Gerin, M., Combes, F., & Nakai, N. 1988, A&A, 203, 44 [NASA ADS] [Google Scholar]
- Gil de Paz, A., Boissier, S., Madore, B. F., et al. 2007, ApJS, 173, 185 [NASA ADS] [CrossRef] [Google Scholar]
- Gordon, K. D., Galliano, F., Hony, S., et al. 2010, A&A, 518, L89 [NASA ADS] [CrossRef] [EDP Sciences] [Google Scholar]
- Grenier, I. A., Casandjian, J.-M., & Terrier, R. 2005, Science, 307, 1292 [NASA ADS] [CrossRef] [PubMed] [Google Scholar]
- Guelin, M., Zylka, R., Mezger, P. G., et al. 1993, A&A, 279, L37 [NASA ADS] [Google Scholar]
- Güsten, R., Nyman, L. Å., Schilke, P., et al. 2006, A&A, 454, L13 [NASA ADS] [CrossRef] [EDP Sciences] [Google Scholar]
- Hildebrand, R. H. 1983, QJRAS, 24, 267 [NASA ADS] [Google Scholar]
- Hughes, A., Wong, T., Ekers, R., et al. 2006, MNRAS, 370, 363 [NASA ADS] [CrossRef] [Google Scholar]
- Hüttemeister, S., Aalto, S., Das, M., & Wall, W. F. 2000, A&A, 363, 93 [NASA ADS] [Google Scholar]
- Ishizuki, S., Kawabe, R., Ishiguro, M., Okumura, S. K., & Morita, K.-I. 1990, Nature, 344, 224 [NASA ADS] [CrossRef] [Google Scholar]
- Issa, M. R., MacLaren, I., & Wolfendale, A. W. 1990, A&A, 236, 237 [NASA ADS] [Google Scholar]
- James, A., Dunne, L., Eales, S., & Edmunds, M. G. 2002, MNRAS, 335, 753 [NASA ADS] [CrossRef] [Google Scholar]
- Jarrett, T. H., Chester, T., Cutri, R., Schneider, S. E., & Huchra, J. P. 2003, AJ, 125, 525 [NASA ADS] [CrossRef] [Google Scholar]
- Jorsater, S., & van Moorsel, G. A. 1995, AJ, 110, 2037 [NASA ADS] [CrossRef] [Google Scholar]
- Jungwiert, B., Combes, F., & Axon, D. J. 1997, A&AS, 125, 479 [NASA ADS] [CrossRef] [EDP Sciences] [Google Scholar]
- Kennicutt, R. C. Jr., 1998, ARA&A, 36, 189 [Google Scholar]
- Kennicutt, R. C. Jr., & Evans, N. J. II, 2012, ARa&A, 50, 531 [Google Scholar]
- Komugi, S., Sofue, Y., Kohno, K., et al. 2008, ApJS, 178, 225 [NASA ADS] [CrossRef] [Google Scholar]
- Kristen, H., Jorsater, S., Lindblad, P. O., & Boksenberg, A. 1997, A&A, 328, 483 [NASA ADS] [Google Scholar]
- Krügel, E. 2003, IoP Series in astronomy and astrophysics (Bristol, UK: The Institute of Physics) [Google Scholar]
- Laine, S., Krause, M., Tabatabaei, F. S., & Siopis, C. 2010, AJ, 140, 1084 [NASA ADS] [CrossRef] [Google Scholar]
- Lindblad, P. O. 1999, A&A Rev., 9, 221 [NASA ADS] [CrossRef] [Google Scholar]
- Lindblad, P. O., Hjelm, M., Hoegbom, J., et al. 1996, A&AS, 120, 403 [NASA ADS] [CrossRef] [EDP Sciences] [Google Scholar]
- Lisenfeld, U., & Ferrara, A. 1998, ApJ, 496, 145 [NASA ADS] [CrossRef] [Google Scholar]
- Madore, B. F., Freedman, W. L., Silbermann, N., et al. 1999, ApJ, 515, 29 [NASA ADS] [CrossRef] [Google Scholar]
- Magrini, L., Corbelli, E., & Galli, D. 2007, A&A, 470, 843 [NASA ADS] [CrossRef] [EDP Sciences] [Google Scholar]
- Misiriotis, A., Xilouris, E. M., Papamastorakis, J., Boumis, P., & Goudis, C. D. 2006, A&A, 459, 113 [NASA ADS] [CrossRef] [EDP Sciences] [Google Scholar]
- Montalto, M., Seitz, S., Riffeser, A., et al. 2009, A&A, 507, 283 [NASA ADS] [CrossRef] [EDP Sciences] [Google Scholar]
- Muñoz-Mateos, J. C., Gil de Paz, A., Boissier, S., et al. 2009, ApJ, 701, 1965 [NASA ADS] [CrossRef] [Google Scholar]
- Ondrechen, M. P., & van der Hulst, J. M. 1989, ApJ, 342, 29 [NASA ADS] [CrossRef] [Google Scholar]
- Pilyugin, L. S., Vílchez, J. M., & Contini, T. 2004, A&A, 425, 849 [NASA ADS] [CrossRef] [EDP Sciences] [Google Scholar]
- Rice, W., Lonsdale, C. J., Soifer, B. T., et al. 1988, ApJS, 68, 91 [NASA ADS] [CrossRef] [Google Scholar]
- Sakamoto, K., Okumura, S. K., Ishizuki, S., & Scoville, N. Z. 1999a, ApJ, 525, 691 [NASA ADS] [CrossRef] [Google Scholar]
- Sakamoto, K., Okumura, S. K., Ishizuki, S., & Scoville, N. Z. 1999b, ApJS, 124, 403 [NASA ADS] [CrossRef] [Google Scholar]
- Sanders, D. B., Mazzarella, J. M., Kim, D., Surace, J. A., & Soifer, B. T. 2003, AJ, 126, 1607 [Google Scholar]
- Sandqvist, A. 1999, A&A, 343, 367 [NASA ADS] [Google Scholar]
- Sandqvist, A., Jorsater, S., & Lindblad, P. O. 1982, A&A, 110, 336 [NASA ADS] [Google Scholar]
- Sandqvist, A., Joersaeter, S., & Lindblad, P. O. 1995, A&A, 295, 585 [NASA ADS] [Google Scholar]
- Schmidt, K., & Boller, T. 1993, Astron. Nachr., 314, 361 [NASA ADS] [CrossRef] [Google Scholar]
- Schuller, F., Menten, K. M., Contreras, Y., et al. 2009, A&A, 504, 415 [NASA ADS] [CrossRef] [EDP Sciences] [Google Scholar]
- Schulz, H., Komossa, S., Schmitz, C., & Mücke, A. 1999, A&A, 346, 764 [NASA ADS] [Google Scholar]
- Siringo, G., Kreysa, E., Kovács, A., et al. 2009, A&A, 497, 945 [NASA ADS] [CrossRef] [EDP Sciences] [Google Scholar]
- Smith, M. W. L., Eales, S. A., Gomez, H. L., et al. 2012, ApJ, 756, 40 [NASA ADS] [CrossRef] [Google Scholar]
- Spinoglio, L., Andreani, P., & Malkan, M. A. 2002, ApJ, 572, 105 [NASA ADS] [CrossRef] [Google Scholar]
- Tabatabaei, F. S., & Berkhuijsen, E. M. 2010, A&A, 517, A77 [NASA ADS] [CrossRef] [EDP Sciences] [Google Scholar]
- Tabatabaei, F. S., Beck, R., Krause, M., et al. 2007, A&A, 466, 509 [NASA ADS] [CrossRef] [EDP Sciences] [Google Scholar]
- Tabatabaei, F. S., Schinnerer, E., Murphy, E. J., et al. 2013, A&A, 552, A19 [NASA ADS] [CrossRef] [EDP Sciences] [Google Scholar]
- Verley, S., Corbelli, E., Giovanardi, C., & Hunt, L. K. 2009, A&A, 493, 453 [NASA ADS] [CrossRef] [EDP Sciences] [Google Scholar]
- Weiß, A., Kovács, A., Güsten, R., et al. 2008, A&A, 490, 77 [NASA ADS] [CrossRef] [EDP Sciences] [Google Scholar]
- Wiebe, D. V., Ade, P. A. R., Bock, J. J., et al. 2009, ApJ, 707, 1809 [NASA ADS] [CrossRef] [Google Scholar]
- Wilson, C. D. 1995, ApJ, 448, L97 [NASA ADS] [CrossRef] [Google Scholar]
- Young, J. S., & Scoville, N. Z. 1991, ARA&A, 29, 581 [NASA ADS] [CrossRef] [Google Scholar]
- Zánmar Sánchez, R., Sellwood, J. A., Weiner, B. J., & Williams, T. B. 2008, ApJ, 674, 797 [NASA ADS] [CrossRef] [Google Scholar]
All Tables
All Figures
|
Fig. 1 Integrated flux density obtained after each iteration in the data reduction. The convergance is reached after the tenth iteration. |
| In the text | |
|
Fig. 2 Left: submm 870 μm emission (contours) superimposed on an optical image (B-band, taken from the STScI Digitized Sky Survey) of NGC 1365. The contour levels are 6, 9, 15, 24, 150, and 500 mJy/beam. The bar shows the optical surface brightness in arbitrary units. Right: submm 870 μm emission, normalized to the one σ noise rms level (signal-to-noise ratio). The angular resolution of 23″ is shown in the lower left corner. |
| In the text | |
|
Fig. 3 Top left: LABOCA 870 μm emission compared with CO(2-1) observations of the central part of NGC 1365 (contours on top of an optical image, see Sandqvist et al. 1995). Top right: contours of the 870 μm emission overlaid on the HI map. Bottom left: the same contours on top of the radio continuum emission at 6 cm and the GALEX FUV map (bottom right). In all panels the resolution of the 870 μm emission is 23″ with contour levels of 6, 9, 15, 24, 150, and 500 mJy/beam. |
| In the text | |
|
Fig. 4 Scale-by-scale correlation between the cold dust emission at 870 μm and the radio continuum emission at 6 cm from NGC 1365 before and after subtracting the central 80″ region. The cross-correlation coefficient rw(a) is higher on spatial scales a where correlations are tighter. |
| In the text | |
|
Fig. 5 Wavelet-decomposed maps at 870 μm (first row) and 6 cm (second row) on scales a ≃ 2, 3.5, 6.4, 8, and 29 kpc. |
| In the text | |
|
Fig. 6 Spectral energy distribution of NGC 1365 (left) and of the central 80″ (right). The colder component provides about 99% of the total dust content in the central part, and 98% in the entire area toward which 870 μm emission is detected. |
| In the text | |
|
Fig. 7 Selected apertures with 36′′ diameter along the bar and northern spiral arm superimposed on the 870 μm map of NGC 1365. |
| In the text | |
|
Fig. 8 Logarithmic contours of dust emission superposed on the near-infrared H image from 2MASS in logarithmic levels. Both images have been deprojected and rotated (50° counterclockwise) such that the major axis is horizontal. |
| In the text | |
|
Fig. 9 Rotation curve and derived frequencies Ω, Ω − κ/2 and Ω + κ/2, for NGC 1365, obtained from the H-band image, and a constant M/L ratio. The model rotation curve has been fitted to the data points compiled from Hα and HI data (see Zanmar Sanchez et al. 2008). |
| In the text | |
|
Fig. 10 Strengths (Q1, Q2, Q4 and total QT) and phases (φ1, φ2 and φ4) of the m = 1 (dash) m = 2 (full line) and m = 4 (dots) Fourier components of the stellar potential. The region of constant m = 2 phase delineates the extent of the bar (note the phase jumps by 2π/m). The φ-angles are measured from the + X axis in the counter-clockwise direction. |
| In the text | |
|
Fig. 11 Map of the gravitational torque (t(x,y) × Σ(x,y), as defined in text) in the center of NGC 1365. The derived torques change sign as expected, following a pattern of four quadrants. The orientation of quadrants follow the bar orientation in NGC 1365. In this deprojected picture, the major axis of the galaxy is oriented parallel to the horizontal axis. |
| In the text | |
|
Fig. 12 Radial variation of the torque, or more precisely, the fraction of the angular momentum transferred from/to the gas in one rotation. |
| In the text | |
Current usage metrics show cumulative count of Article Views (full-text article views including HTML views, PDF and ePub downloads, according to the available data) and Abstracts Views on Vision4Press platform.
Data correspond to usage on the plateform after 2015. The current usage metrics is available 48-96 hours after online publication and is updated daily on week days.
Initial download of the metrics may take a while.