Fig. 2
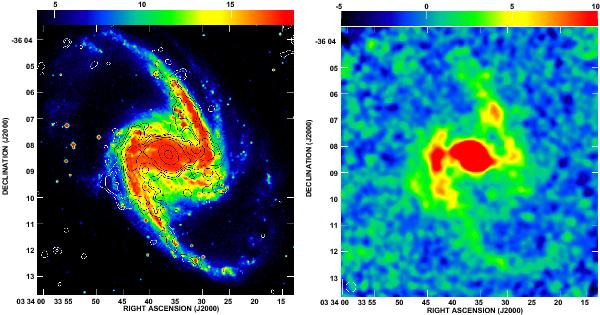
Left: submm 870 μm emission (contours) superimposed on an optical image (B-band, taken from the STScI Digitized Sky Survey) of NGC 1365. The contour levels are 6, 9, 15, 24, 150, and 500 mJy/beam. The bar shows the optical surface brightness in arbitrary units. Right: submm 870 μm emission, normalized to the one σ noise rms level (signal-to-noise ratio). The angular resolution of 23″ is shown in the lower left corner.
Current usage metrics show cumulative count of Article Views (full-text article views including HTML views, PDF and ePub downloads, according to the available data) and Abstracts Views on Vision4Press platform.
Data correspond to usage on the plateform after 2015. The current usage metrics is available 48-96 hours after online publication and is updated daily on week days.
Initial download of the metrics may take a while.