Fig. 3
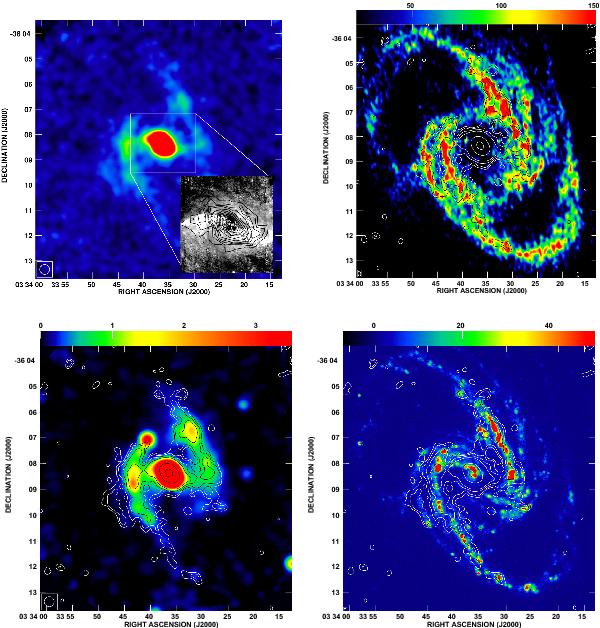
Top left: LABOCA 870 μm emission compared with CO(2-1) observations of the central part of NGC 1365 (contours on top of an optical image, see Sandqvist et al. 1995). Top right: contours of the 870 μm emission overlaid on the HI map. Bottom left: the same contours on top of the radio continuum emission at 6 cm and the GALEX FUV map (bottom right). In all panels the resolution of the 870 μm emission is 23″ with contour levels of 6, 9, 15, 24, 150, and 500 mJy/beam.
Current usage metrics show cumulative count of Article Views (full-text article views including HTML views, PDF and ePub downloads, according to the available data) and Abstracts Views on Vision4Press platform.
Data correspond to usage on the plateform after 2015. The current usage metrics is available 48-96 hours after online publication and is updated daily on week days.
Initial download of the metrics may take a while.