| Issue |
A&A
Volume 555, July 2013
|
|
|---|---|---|
| Article Number | A12 | |
| Number of page(s) | 16 | |
| Section | Galactic structure, stellar clusters and populations | |
| DOI | https://doi.org/10.1051/0004-6361/201321470 | |
| Published online | 19 June 2013 | |
Through thick and thin: Structure of the Galactic thick disc from extragalactic surveys⋆,⋆⋆
1 Institute of Astronomy, University of Cambridge, Madingley road, CB3 0HA, Cambridge, UK
e-mail: gkordo@ast.cam.ac.uk
2 Laboratoire Lagrange, UMR 7293, Université de Nice Sophia Antipolis, CNRS, Observatoire de la Côte d’Azur, BP 4229, 06304 Nice, France
3 Johns Hopkins University, 3400 N Charles Street, Baltimore, MD 21218, USA
4 Kapteyn Astronomical Institute, University of Groningen, PO Box 800, 9700 AV Groningen, The Netherlands
5 INAF – Osservatorio Astronomico di Bologna, via Ranzani 1, 40127 Bologna, Italy
6 Department of Physics and Astronomy, University of Victoria, PO Box 3055, STN CSC, Victoria BC V8W 3P6, Canada
Received: 14 March 2013
Accepted: 21 May 2013
Context. We aim to understand the accretion history of the Milky Way by exploring the vertical and radial properties of the Galactic thick disc.
Aims. We study the chemical and kinematic properties of roughly a thousand spectra of faint magnitude foreground Galactic stars observed serendipitously during extra-galactic surveys in four lines-of-sight: three in the southern Galactic hemisphere (surveys of the Carina, Fornax and Sculptor dwarf spheroidal galaxies) and one in the northern Galactic hemisphere (a survey of the Sextans dwarf spheroidal galaxy). The foreground stars span distances up to ~3 kpc from the Galactic plane and Galactocentric radii up to 11 kpc.
Methods. The stellar atmospheric parameters (effective temperature, surface gravity, metallicity) are obtained by an automated parameterisation pipeline and the distances of the stars are then derived by a projection of the atmospheric parameters on a set of theoretical isochrones using a Bayesian approach. The metallicity gradients are estimated for each line-of-sight and compared with predictions from the Besançon model of the Galaxy, in order to test the chemical structure of the thick disc. Finally, we use the radial velocities in each line-of-sight to derive a proxy for either the azimuthal or the vertical component of the orbital velocity of the stars.
Results. Only three lines-of-sight have a sufficient number of foreground stars for a robust analysis. Towards Sextans in the Northern Galactic hemisphere and Sculptor in the South, we measure a consistent decrease in mean metallicity with height from the Galactic plane, suggesting a chemically symmetric thick disc. This decrease can either be due to an intrinsic thick disc metallicity gradient, or simply due to a change in the thin disc/thick disc population ratio and no intrinsic metallicity gradients for the thick disc. We favour the latter explanation. In contrast, we find evidence of an unpredicted metal-poor population in the direction of Carina. This population was earlier detected, but our more detailed analysis provides robust estimates of its location (|Z| < 1 kpc), metallicity (−2 < [M/H] < −1 dex) and azimuthal orbital velocity (Vφ ~ 120 km s-1).
Conclusions. Given the chemo-dynamical properties of the over-density towards the Carina line-of-sight, we suggest that it represents the metal-poor tail of the canonical thick disc. In spite of the small number of stars available, we suggest that this metal-weak thick disc follows the often suggested canonical thick disc velocity-metallicity correlation of ∂Vφ/∂ [M/H] ~ 40−50 km s-1 dex-1.
Key words: Galaxy: evolution / Galaxy: structure / Galaxy: disk / stars: abundances / methods: observational / Galaxy: stellar content
Based on observations collected at the European Southern Observatory at Paranal, Chile, ESO Large Programme 171.B-0588 (DART) and 171.B-0520(A).
Full Tables 2 and 4 are only available at the CDS via anonymous ftp to cdsarc.u-strasbg.fr (130.79.128.5) or via http://cdsarc.u-strasbg.fr/viz-bin/qcat?J/A+A/555/A12
© ESO, 2013
1. Introduction
Surveys of external galaxies suggest that thick discs are inherent structures in most disc galaxies (Yoachim & Dalcanton 2008; van der Kruit & Freeman 2011). The existence of such a structure for the Milky Way was proposed thirty years ago (Gilmore & Reid 1983), but its origin remains uncertain, and many scenarios have been proposed for its formation, either through internal processes or due to external accretion or trigger (Abadi et al. 2003; Brook et al. 2007; Villalobos & Helmi 2008; Loebman et al. 2011; Rix & Bovy 2013,and references therein).
Most of the stellar spectroscopic and photometric surveys have shown that the Galactic thick disc is mainly composed by old stars (older than ~10 Gyr, Gilmore et al. 1995; Fuhrmann 2008), of intermediate metallicity ([M/H] ~ −0.5 dex, Gilmore & Wyse 1985; Bensby et al. 2007; Kordopatis et al. 2011b). In addition, its stars at the solar cylinder have a ratio of α-elements to iron abundances ([α/Fe]), which is enhanced compared to the [α/Fe] abundances of thin disc stars (e.g. Bensby et al. 2005; Mishenina et al. 2006; Reddy et al. 2006; Fuhrmann 2008), which suggests that the thick disc stars were formed on relatively short timescales (~1 Gyr), thus offering us the possibility of deciphering the merging history of our Galaxy back to redshifts of z ~ 1.5−2.
The amplitudes of vertical and radial gradients in the properties of the thick disc place very strong constraints on Galaxy formation mechanisms, and there has been significant recent effort towards their measurement. However, the recent results from the SDSS (York et al. 2000), SEGUE (Yanny et al. 2009) and RAVE (Steinmetz et al. 2006) surveys have been obtained either by photometry, from low resolution spectra, or only for bright, local stars, and are hence limited in either accuracy or volume sampled (Lee et al. 2011; Chen et al. 2011; Cheng et al. 2012; Schlesinger et al. 2012; Ruchti et al. 2011).
Prior to the first results of the Gaia-ESO large observing program (Gilmore et al. 2012), the only intermediate resolution spectroscopic survey studying the thick disc far from the solar neighbourhood is that of Kordopatis et al. (2011b). In that study, the authors determined the stellar parameters of roughly 700 stars, from spectra covering the wavelength range of the infrared ionised calcium triplet (IR CaII, λ ~ 8500 Å), observed towards the Galactic coordinates (l,b) ~ (277°,47°) and probing distances from the Galactic plane of up to 8 kpc. They found a vertical metallicity gradient of dex kpc-1, the value of which could be explained simply by the changing ratio between thin and thick disc stars as one moves away from the Galactic plane, without any intrinsic vertical metallicity gradient for the stars of the thick disc. Combining this result with their results for the vertical gradients in Galactocentric rotational velocity and with their finding of no metallicity dependence of the scale-height and scale-length of the thick disc, these authors proposed that the dominant formation mechanisms that could explain their observations were either dynamical heating of a pre-existing thin disc or accretion of a gas-rich satellite.
Here we expand upon the earlier study of Kordopatis et al. (2011b) with four additional lines-of-sight (los), analysing the foreground Galactic stars of the extragalactic stellar survey of the Dwarf Abundances and Radial velocities Team (DART, Tolstoy et al. 2006) towards the Sculptor, Fornax and Sextans dwarf spheroidal galaxies (dSph), together with the foreground stars observed as part of the ESO large program 171.B-0520(A) to study the Carina dSph. This paper is structured as follows: in Sect. 2 we present the dataset and explain how the stellar atmospheric parameters were obtained using an automated pipeline. In Sect. 3 we compute spectroscopic distances for all the stars (both members of the dSph and in the foreground), describe how we select our final sample of foreground Galactic stars, and derive an estimator for the orbital azimuthal velocity of the stars. Then, in Sect. 4, we compare these results with predictions from the Besançon model in each line-of-sight to aid the identification of substructure. Finally, in Sect. 5 we discuss possible origins for the over-density we find in the line-of-sight towards Carina, and Sect. 6 presents our conclusions.
Lines-of-sight and available spectra.
2. Measurement of the stellar atmospheric parameters
2.1. Description of the datasets
In this work, we made extensive use of the spectroscopic data from the extragalactic survey DART and from the observing program 171.B-0520(A).
The large ESO observing program DART aimed to determine the chemical and dynamical properties of three dwarf spheroidal galaxy (dSph) satellites of the Milky Way. This survey obtained medium- (R ~ 6500) and high- (R ~ 20 000) resolution spectra in lines-of-sight towards Sculptor (l ~ 287.5°, b ~ −83.2°), Sextans (l = 243.5°, b = 42.3°) and Fornax (l = 237.1°, b = −65.7°). In this paper we used the subset of medium resolution spectra, taken around the IR CaII triplet at ~8500 Å, with the VLT-ESO FLAMES-Giraffe spectrograph at the LR8 setup. The data-reduction procedure and the techniques for derivation of the radial velocities that we adopted are described in detail in Battaglia et al. (2008). The targets observed towards the Carina line-of-sight were observed as part of a second ESO large observing program (see Koch et al. 2006, for a discussion of the Carina member stars) and were observed with the same spectrograph, and reduced following the same procedure as in Battaglia et al. (2008).
The total number of targets observed towards the lines-of-sight to Sculptor, Sextans, Fornax and Carina were, respectively, 1488, 1022, 1060 and 939, for which repeat observations were gathered for several of them. The entire database for these four line-of-sight contains 6576 spectra, consisting of 2393, 1512, 1352 and 1319 spectra, respectively, for each (see Fig. 1 and Table 1). As will be shown in the following sections, out of these 6576 spectra, only 679 targets represent foreground stars (see Sect. 3.2).
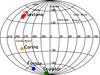 |
Fig. 1 Aitoff projection of the Galactic coordinates of the targets. The lines-of-sight of Sculptor, Sextans, Fornax and Carina are represented in green, red, blue and orange colours, respectively. The positions of other dwarf galaxies, including ultra faint dwarfs, have also been indicated. |
2.2. Adopted pipeline for the automated parameterisation
An updated version of the pipeline presented in Kordopatis et al. (2011a) was developed to obtain estimates of the values of the atmospheric parameters of the stars. This procedure consists of using two different algorithms simultaneously, MATISSE (Recio-Blanco et al. 2006) and DEGAS (Bijaoui et al. 2012), to renormalise (iteratively) the spectra, compute the mean signal-to-noise ratio (S/N) per pixel and derive the atmospheric parameters of the observed stars, as well as their associated internal errors. The learning phase for the algorithms is based on a grid of synthetic spectra covering Teff from 3000 K to 8000 K, log g from 0 to 5 (cm s-2) and [M/H] from − 5 dex to + 1.0 dex. A coupling between the overall metallicity and the α −element abundances1 is assumed according to the commonly observed enhancements in local metal-poor thick disc stars:
-
[α/Fe] = 0.0 dex for [M/H] ≥ 0.0 dex
-
[α/Fe] = −0.4 × [M/H] dex for − 1 ≤ [M/H] ≤ 0 dex
-
[α/Fe] = +0.4 dex for [M/H] ≤ −1.0 dex.
Compared to the previous learning grid used in Kordopatis et al. (2011a), new model spectra have been added, to maintain a constant metallicity step of 0.25 dex across all the parameter space and to minimise the border effects and discretisation problems encountered by Kordopatis et al. (2011a). These additional spectra have been computed by linearly interpolating the flux between the available nominal spectra from the previous version of the reference grid. After this procedure, the updated pipeline has a nominal grid of 4571 synthetic spectra.
In addition, the updated pipeline includes the capability of imposing soft priors, based on the observational strategy and the known selection function of the survey. For example, one can remove from the solution space all the templates which do not correspond to the photometric temperatures expected, based on the colour-magnitude cuts used to select the sample. Removing such templates greatly reduces the degeneracy problems from which all automated parameterisation algorithms may suffer and hence improve the accuracy of the results.
The selection functions of the DART and Carina surveys were defined to identify stars on the Red Giant Branches of the targeted dSph. The samples observed therefore consist of faint stars (16 < V < 20 mag) with a colour range of 0.6 < (V − I) < 2.1 mag. Given these criteria, and using the photometric temperature calibration relations of Ramírez & Meléndez (2005) and Casagrande et al. (2010), the effective temperatures of the stars should be in the range 3500 ≤ Teff ≤ 6500 K, no matter their metallicity or surface gravity. We therefore ran the pipeline with a prior such that only solutions within this range were retained.
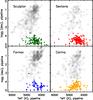 |
Fig. 2 Effective temperature (Teff) – surface gravity (log g) diagram representing the parameters measured by the pipeline. The foreground stars corresponding to the line-of-sight of Sculptor are represented in green, the ones towards Sextans in red, towards Fornax in blue and towards Carina in orange. The background extragalactic stars, as selected in Sect. 3.2, are represented in grey open circles. |
Atmospheric parameters of the selected foreground stars.
The output values of the stellar atmospheric parameters of the foreground stars, as selected in Sect. 3.2, are listed in the electronic Table 2. They are also plotted in the Teff – log g diagram of Fig. 2 together with the parameters of the dSph members for which we had spectra with S/N > 10 pixel-1. The distribution of the points in this diagram is noisy, especially along the gravity axis, due to the low S/N of the spectra (ranging from ~3 to 70 pixel-1), combined with the poor gravity-sensitivity of the spectral features available in the IR-Ca II triplet region. Indeed, as shown in Kordopatis et al. (2011a), surface gravity is poorly constrained for main-sequence dwarfs, due to the lack of sensitivity of the spectral lines to small variations of log g. Nevertheless, we verified that differentiation between dwarfs and giants can be achieved fairly easily, based (among others) on the strength of the Mg i line at 8806.8 Å, which is more prominent in the spectra of dwarfs (see also Battaglia & Starkenburg 2012).
Finally, we note that a work in progress comparing metallicities obtained from high-resolution spectra with the results obtained from the present pipeline applied to spectra from the RAVE survey, of the same wavelength range and spectral resolution as the present work (Kordopatis et al., in prep.), shows that the pipeline metallicities have to be corrected by a low order polynomial which is a function of log g and [M/H]. The relation that we used to correct the pipeline metallicity values is the following: ![\begin{eqnarray} {\rm [M/H]}_{\rm p} - {\rm [M/H]}_{\rm c}=-0.076 - 0.006 * \log g + 0.003*\log^2g \notag\\ - 0.021* {\rm [M/H]}_{\rm p}*\log g\!+\!0.582* {\rm [M/H]}_{\rm p}\!+\!0.205*{\rm [M/H]}_{\rm p}^2 \label{eq:calib_meta} \end{eqnarray}](/articles/aa/full_html/2013/07/aa21470-13/aa21470-13-eq61.png) (1)where [M/H] c and [M/H] p are the corrected and pipeline metallicity values. This calibration suggests a correction of less than 0.1 dex for solar-metallicity dwarfs and ~0.35 dex for giants of metallicity between dex. There is no indication of the need for corrections to the pipeline output for Teff or log g. Both the pipeline metallicities and the calibrated metallicities are listed in the electronic Table 2, but for the remainder of this paper, “metallicity” will refer to only the calibrated value.
(1)where [M/H] c and [M/H] p are the corrected and pipeline metallicity values. This calibration suggests a correction of less than 0.1 dex for solar-metallicity dwarfs and ~0.35 dex for giants of metallicity between dex. There is no indication of the need for corrections to the pipeline output for Teff or log g. Both the pipeline metallicities and the calibrated metallicities are listed in the electronic Table 2, but for the remainder of this paper, “metallicity” will refer to only the calibrated value.
 |
Fig. 3 Comparison of the internal uncertainties (in red) with the 70th percentile of the dispersion distribution of the repeated observations of dwarf stars more metal rich than [M/H] ~ − 1.25 dex for Teff (top), log g (middle) and [M/H] (bottom). |
2.3. Total uncertainties in the estimated parameters
Based on the repeated observations, we investigated to which extent the internal uncertainties, purely associated to our pipeline’s parameter estimations, were realistic. The internal uncertainties in a given set of atmospheric parameters derived by the pipeline from a spectrum of a given S/N are estimated from the values given in Table 4 of Kordopatis et al. (2011a). That analysis was based on the results derived from synthetic spectra with white Gaussian noise, and it assumed there were no correlations between different parameters, no spectral degeneracies and Gaussian uncertainties. The validity of these assumptions may be assessed by comparing those uncertainties with the dispersions in parameter values derived from repeated observations of the same star.
The current analysis focuses on foreground dwarf stars and we therefore investigated the repeat observations of those stars that the pipeline identifies as dwarfs. We first measured the dispersion in the parameter estimations for each star observed multiple times, and associated to that dispersion the mean S/N of the stellar spectra under consideration. Then, for different S/N bins, the 70th percentile of the dispersion distribution was measured and compared to the internal uncertainties for FGK dwarfs of metallicities down to − 1 dex at that S/N. Figure 3 shows the comparison between the internal uncertainties (red plus signs) and the dispersions in the values of the parameters for the repeats that have been designated as dwarfs, with metallicities higher than − 1.25 dex (black curves). It is apparent that we slightly over-estimate the errors for the high S/N regimes, and under-estimate them by a factor of less than two at a S/N ~ 10 pixel-1. The different behaviours of the uncertainties from the repeats and the estimated internal errors seen in the Fig. 3 are due in part to the fact that the abscissa of the black curves is not truly the S/N but rather the mean S/N of the spectra under consideration. Additional factors behind the disagreement are that the error ellipsoid has not been taken into consideration when computing the uncertainties, as well as the fact that we are now dealing with observed spectra rather than synthetic ones. Nevertheless, despite these approximations, the agreement is satisfactory.
Estimation of the external uncertainties.
In order to treat the uncertainties of the pipeline realistically, external errors must be evaluated and added quadratically to the internal ones. For that reason, we have used the external uncertainty estimations used in Kordopatis et al. (in prep.), obtained for a set of roughly 800 stars with S/N > 50 pixel-1, observed by RAVE at the same wavelength range and spectral resolution, and for which atmospheric parameters were available from high-resolution spectroscopy. The adopted external uncertainties are given in Table 3.
Finally, each star should have only one estimated value of the atmospheric parameters in the database, to avoid biases in the sample distributions. Thus for the spectra corresponding to the same object, the mean of the parameter values was computed, weighted by the S/N of the respective spectrum. Hence, for a given parameter value θi,s, associated with spectrum s and an object i, the adopted final parameter value is: 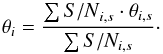 (2)The errors σθi of the parameters have been computed as the weighted standard deviation:
 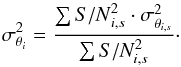 (3)Figure 4 illustrates the relation between the radial velocity, Vrad, and the metallicity of the foreground (filled circles) and dSph (open circles) stars in our sample, as they are defined in Sect. 3.2. The stars belonging to the dSph are concentrated within narrow radial velocity distributions, and they span low metallicity values, as expected. The mild over-densities at discrete metallicity values that can be noticed for the foreground stars are a signature of the DEGAS algorithm, which tends to find parameter values close to those of the learning grid points. We emphasise that this discretisation does not affect in any way the accuracy of the parameter estimations, as tests have shown that this pseudo-discretisation minimises the internal errors of the pipeline (Kordopatis et al. 2011a).
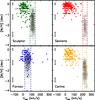 |
Fig. 4 Radial velocity versus overall metallicity for all the lines-of-sight. The colour coding is the same as in Fig. 2. Typical internal uncertainties, at different metallicity regimes, and for the whole dataset (including the faint extra-galactic stars plotted as grey empty circles) are represented in the left part of the plots. The dotted vertical lines represent for each line-of-sight the adopted radial velocity range of the stars belonging to each dwarf spheroidal galaxy. |
3. Computation of the distances and final sample selection
Any investigation of the chemical structure of the thin and thick discs must first determine stellar distances, and then gradients and distribution functions. In the absence of parallaxes, the best way to estimate distances is by the projection of the stellar atmospheric parameters onto a set of theoretical isochrones to obtain the absolute magnitude. We explain below how we implemented such a procedure to obtain the distances of the targets, then discuss which criteria were used to disentangle the foreground stars from those belonging to the background dSphs, and describe how we obtained a proxy for the azimuthal velocity of the stars.
3.1. Computation of the distances
We used the same procedure as presented in Kordopatis et al. (2011b) to obtain, for each star, the line-of-sight distance (D), as well as the Galactocentric radius in cylindrical coordinates (R) and the distance above the Galactic plane (Z).
This procedure consists of assigning a weight to each point of a set of theoretical isochrones, taking into account the derived stellar atmospheric parameters, their total uncertainties (internal and external) and the Bayesian probability of a star to be in a particular evolutionary phase. It is worth mentioning that in our implementation this probability is simply related to the amount of time spent by a star in each evolutionary phase of an isochrone, and is not related to any priors based on the Galactic stellar population such as was the case in, for example, Burnett & Binney (2010). The most likely absolute magnitude of the star is then obtained by computing the weighted mean of all the absolute magnitudes (in a given band) of the isochrones.
First, we de-reddened the magnitudes of our stars, adopting the extinction values of Schlegel et al. (1998), given in Table 1. We adopted the same extinction for all the stars in each line-of-sight. This may be justified by the fact that most of the inter-stellar matter is confined close to the Galactic plane, within a scale-height of ~150 pc (Misiriotis et al. 2006), and that most of the observed stars lie beyond a vertical distance of Z = 300 pc. We then generated our own set of isochrones by using the YYmix2 interpolation code, based on the Yonsei-Yale (Y2) models (version 2, Demarque et al. 2004), combined with the Lejeune et al. (1998) colour table, as in Kordopatis et al. (2011b). We set the youngest age of the isochrones at 2 Gyr, based on the expectation that the observed stars will be from the old thin disc, the thick disc and the stellar halo. The interpolated isochrones have a constant age step of 1 Gyr, up to 14 Gyr. In addition, we used the full metallicity range of the Y2 models, ranging from [Fe/H] = − 3.0 dex to [Fe/H] = + 0.8 dex. The step in metallicity is constant, equal to 0.1 dex, smaller than the typical error on the derived metallicities of the observed stars (typically ~0.15 − 0.2 dex, see Fig. 3). The adopted values for the α-enhancements at different metallicities are the same as those used for the grid of synthetic spectra described in Sect. 2.2. In the end, a set of 494 isochrones were generated.
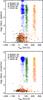 |
Fig. 5 Radial velocity versus surface gravity, using the results from the parameterisation pipeline (upper panel) and those projected on the Yonsei-Yale isochrones (lower panel). Open symbols correspond to the targets that have the same velocity as the dSph in their line-of-sight and have a projected (log) surface gravity less than 3.75 cm s-2. |
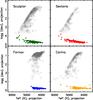 |
Fig. 6 Effective temperature (Teff) – surface gravity (log g) diagram using the parameter values obtained after projection onto isochrones (see Sect. 3.1), for all the observed targets of the DART and Carina surveys. For each line-of-sight, the filled symbols correspond to the foreground stars that are considered in this study, while the open grey circles are the dSph members. |
Figure 5 demonstrates the change in the estimates of surface gravities before and after the projection onto the isochrones, as a function of the radial velocity. Foreground stars, as selected in Sect. 3.2, are plotted in filled circles, and extra-galactic stars as open circles. It is apparent that projection onto the isochrones makes the distinction between dwarf stars (log g> 3.75 cm s-2) and giants clearer; in the case of stars having a radial velocity equal to that of the dSph, this distinction corresponds to differentiating extra-galactic (giant) stars from foreground (dwarf) ones. The improvement in the estimation of the atmospheric parameters can also be seen in Fig. 6, showing the Teff – log g diagram of the projected parameters. Compared to the distribution in Fig. 2, the stars for which the pipeline obtained unrealistic parameter combinations (e.g. Teff ~4200 K, log g ~ 4.0 cm s-2 and high [M/H]), have been moved by the projection into allowed locations, either the red giant branch or the main sequence. The values of the projected effective temperatures and surface gravities are listed in the electronic Table 2, next to the raw pipeline results.
 |
Fig. 7 V-magnitude versus derived line-of-sight distance for the foreground stars, as derived by our pipeline (in a logarithmic scale). The errors in the distances are as indicated. |
Figure 7 shows the derived distances versus the apparent V-magnitudes for the foreground stars (selected as in Sect. 3.2), with individual error bars for each measurement (see Table 4, available electronically, for the individual values). Most of the stars follow a similar trend, within the error bars, with the faintest stars being also the most distant. This is consistent with a sample dominated by dwarf stars, as expected for this study of the foreground sample.
Finally, we verified our distance estimation pipeline by selecting the dSph targets (see Sect. 3.2) for which good quality spectra were available (S/N > 20 pixel-1). The mean derived distances are 74 ± 17 kpc, 60 ± 21 kpc, 117 ± 18 kpc and 109 ± 27 kpc, respectively for the dSph of Sculptor, Sextans, Fornax and Carina. Although these extragalactic stars have α-abundances different from the ones assumed in the grid of synthetic spectra (see, for example Tolstoy et al. 2009), and that for giant stars the uncertainties are greater than for the dwarfs for both the atmospheric parameters and the distances, we note that these values are in a fairly good agreement with the commonly admitted values of 72 ± 5 kpc, 83 ± 9 kpc, 120 ± 8 kpc and 85 ± 5 kpc for Sculptor, Sextans, Fornax and Carina, respectively (Irwin & Hatzidimitriou 1995).
Positions, radial velocities, magnitudes, and distances of the selected foreground stars.
3.2. Identification of the foreground stars
Foreground stars were isolated by the removal from the sample of all “extragalactic stars”, namely those stars with a projected log g< 3.75 cm s-2 (in order to select the giants), and having radial velocities within 3σ of the nominal centre-of-mass radial velocity of the respective dSph in each line-of-sight (see Fig. 4). In this procedure, we adopted the values of (54 ± 11.4) km s-1, (110 ± 10.1) km s-1, (226 ± 8.4) km s-1, (224 ± 7.5) km s-1 as central and dispersion values of the radial velocity distributions of Fornax, Sculptor, Sextans and Carina, respectively (Battaglia et al. 2006, 2008, 2011; Koch et al. 2006).
Furthermore, we removed all the spectra with radial velocity errors greater than 10 km s-1 (~2/3 of a sampled pixel), as determined in Battaglia et al. (2008). Indeed, Kordopatis et al. (2011a), have shown that the pipeline’s errors on the final atmospheric parameters, using spectra from the same setup, are not affected as long as the errors on the Doppler corrections are lower than this threshold value. We also removed all the stars for which the error on the distance was higher than 50%, in order to obtain more robust results in the following analysis. It should be noted that such a threshold on the distance error removes preferentially turn-off stars, since the projection of the pipeline’s parameters on the isochrones for stars in that evolutionary phase will result to a higher uncertainty in the derivation of their absolute magnitude.
Finally, we made an additional selection based on the apparent magnitude of the stars, discarding the faintest targets, with V > 19.5 mag. We made a cut on the received flux (apparent magnitude), rather than on S/N, in order to avoid the possibility of introducing spurious selection biases due to our definition of S/N. Recall that, as in Kordopatis et al. (2011a), the mean S/N per pixel of a given spectrum is obtained as follows: given a solution spectrum template, we compute for each pixel the difference with the observation, and then select only the adjacent pixels with a flux close to 1, for which the difference changes sign. The S/N is then estimated by measuring the dispersion of the selected pixels. This method has been shown in Zwitter et al. (2008) to give relatively reliable measures of the S/N, but in the case of the most metal-poor stars, the dispersion in flux of the continuum pixels is usually over-estimated, due to a combination of the facts that they are very numerous and that for these stars there are very few suitable spectral signatures for accurate determination of the atmospheric parameters. Similarly, faint metal-rich stars are also measured with a lower S/N than in reality, since some of the metallic lines can be mis-identified as noise. That being said, we did discard any star having S/N < 2 pixel-1 since this low a value indicates that either the stellar spectrum is missing or that the fibre was not been centred properly on the star (so that the received flux did not scale correctly with apparent magnitude).
Applying the above rejection criteria, we selected 679 foreground stars in total: 166 in the Sculptor line-of-sight, 219 towards the Sextans line-of-sight, 86 towards the Fornax line-of-sight and 208 towards the Carina line-of-sight. The stars span distances from 200 pc up to ~7 kpc, with the majority of the targets closer than 3 kpc from the Galactic plane.
 |
Fig. 8 Absolute distance above the Galactic plane (Z) versus the Galactocentric radial distance (R⊙ = 8 kpc) for the foreground stars. The colour code goes from blue for the most metal-poor stars to red for the most metal-rich. The pencil beams, from left to right, correspond to the lines-of-sight of Sculptor, Fornax, Sextans and Carina, respectively. The median error for the entire foreground dataset is represented at the lower right corner. |
Figure 8 shows the position of the stars in the | Z | versus R plane, with the points being colour-coded according to the stellar metallicity. We assumed that the Sun is located at R⊙ = 8 kpc (Reid 1993). As may be seen from the figure, the mean metallicity of the stars separates into two regimes, with the division at around ~0.8 kpc from the Galactic plane. Closer than |Z| ~ 0.8 kpc, the stars are predominantly metal-rich ([M/H] > −0.5 dex), whereas farther than 0.8 kpc, they are mostly metal-poor ([M/H] < −0.5 dex). The metallicity and | Z | distance of this division suggest that we are seeing the transition from predominantly thin disc stars to thick disc stars. Indeed, with a scale-height of hZ ~ 800−1000 pc, compared to hZ ~ 200−300 pc for the scale-height of the thin disc, the distance above the Galactic plane at which the thick disc is expected to become the dominant population is around 1 kpc, given a local density of approximately 10–15% for the thick disc stars (see for example Soubiran et al. 2003; Girard et al. 2006; Jurić et al. 2008; de Jong et al. 2010, and references therein).
We decided to discard the Fornax line-of-sight from the rest of the analysis, given the relatively small number of foreground stars identified towards this direction (N = 86), as well as the relatively small range in distances spanned by these stars. In addition, the radial velocity of the Fornax dSph lies within the range of the foreground disc stars, which could result in some background stars (dSph members) contaminating the foreground sample if their surface gravity were incorrectly estimated.
 |
Fig. 9 True azimuthal velocity Vφ (dashed histograms) computed from simulations of the Besançon model and the estimator |
 |
Fig. 10 V–magnitude versus (V − I) colour for the foreground data (coloured circles) and the biased Besançon models (shown in grey-scale in each panel). The simulated samples follow the same V and (V − I) distributions as the selected observed stars. |
3.3. Estimation of the azimuthal orbital velocity Vφ
No proper motions are available for the foreground stars of our sample and hence no 3D motions can be derived. Nevertheless, the radial velocity, combined with the distance estimation, can give us valuable information about the azimuthal motion of the stars (Vφ) which in turn can be used to classify stars as belonging to either the thick or thin disc – or to some other component of the Galaxy. For this purpose we follow the approach of Morrison et al. (1990), Wyse et al. (2006).
We define VGal as the Galactocentric velocity of a star along the line-of-sight from the Sun to the star as:  (4)where Vrad is the heliocentric radial velocity (line-of-sight velocity), vpec, ⊙ ,(l,b) = 15.4 km s-1 is the adopted peculiar motion of the Sun in the direction (l,b) = (51°, + 23°), and VLSR = 220 km s-1 is the adopted circular velocity of the local standard of rest.
In spherical coordinates, one can also decompose VGal = αVr + βVφ + γVθ, where the coefficients depend on the position of the stars in the Galaxy, and can be expressed as a function of the Galactic coordinates (l,b) and D, the line-of-sight distance. Given the reasonable assumption that the mean motions in r- and θ- are zero,  can be used as an unbiased estimator of the true azimuthal velocity Vφ.
The coefficient β may be expressed in terms of the projection of the heliocentric distance D on the Galactic plane (u) and the distance of the Sun from the Galactic centre (R⊙ = 8 kpc): 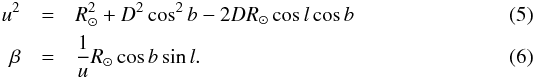 For stars close to the tangent point (l = 270°), as is the case for these dSph lines-of-sight, the above equations show that
  will be a good estimator of Vφ at low Galactic latitudes, whereas the closer the line-of-sight is to the poles, the less the contribution of Vrad to Vφ (since β ~ 0). This is illustrated in Fig. 9, which shows histograms of both the estimator and the true Vφ for three different lines-of-sight. The distributions of values for these plots have been obtained from the predicted stellar positions, velocities and proper motions of the Besançon model (see next section). It can be seen that while for the Sextans and Carina line-of-sight,
  , this is clearly not the case for the Sculptor line-of-sight, where the estimator for the azimuthal velocity cannot be used for the purpose of the present analysis. This is not too surprising, since for this high-latitude line-of-sight Vrad ~ − VZ.
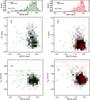 |
Fig. 11 Position above the Galactic plane (middle panels) and radial velocity (bottom panels) versus metallicity for the observations (in green for the Sculptor line-of-sight on the left-hand side and red for the Sextans line-of-sight on the right-hand side). The predictions of the Besançon model are shown in grey-scale. The horizontal dashed lines indicate the range of radial velocities appropriate for member stars of the respective dSph. The panels at the very top show the metallicity distributions of the foreground stars in these two lines-of-sight and the Kolmogorov-Smirnov probability of not rejecting the null hypothesis. |
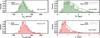 |
Fig. 12 Comparisons of the histograms of the simulated catalogue and the observations towards the line-of-sight of Sculptor (upper panel) and the line-of-sight of Sextans (lower panel). The Kolmogorov-Smirnov probability of not rejecting the null hypothesis is written in the right side of each histogram, and is representative of a single Monte-Carlo realisation. |
4. Characterisation of the chemical properties of the Galactic discs
4.1. Creation of a comparison catalogue with the Besançon Galactic model
The interpretation of our results is facilitated by comparisons with simulated populations in each line-of-sight obtained from the Besançon model of the Galaxy2 (Robin et al. 2003). We recall that in the Besançon model, the Galactic thin disc has both vertical and radial metallicity gradients, the vertical one being driven by the superposition of seven stellar populations of different ages and metallicities, and the radial one being fixed at ∂[Fe/H]/∂R = − 0.07 dex kpc-1. On the contrary, there are no metallicity gradients within the modelled Galactic thick disc, which is assumed to have a mean metallicity of − 0.78 dex, lower compared to the values of ~− 0.6 dex, as derived by most recent investigations (see, for example, Bensby et al. 2007; Kordopatis et al. 2011b). We therefore adjusted the mean metallicity of the simulated thick-disc population by the addition of 0.2 dex. The simulated stellar catalogues were then used to select sub-samples to match our observations, through the imposition of the same V-magnitude and (V − I) distributions as in the data (see Fig. 10). In addition, the simulated Galactic giant stars (log g< 3.75 cm s-2) that had a radial velocity within the distribution of the dSph of that line-of-sight were removed. Finally, for each simulated star we assigned typical errors on the metallicities and distances, matching the general trend in errors of our observations. Thus for each metallicity and distance value in the simulated catalogues, we defined a Gaussian error distribution function of standard deviation σD or σ[M/H], from which a random error value was drawn and then assigned to the given parameter. The standard deviations that were assumed for the distances and the metallicities were σD = 0.07 × D and σ[M/H] = − 0.12 × [M/H] + 0.45 dex, respectively. We note that the error modelling overestimates errors for the good quality spectra (e.g. those of high S/N), but underestimates them for the low quality ones. Nevertheless, the present analysis does not require a more sophisticated model for the errors.
4.2. The Sculptor and Sextans lines-of-sight
Figure 11 shows Z-distance from the Galactic plane and radial velocities versus metallicity for the observed foreground stars, together with the predictions from the Besançon models (after appropriate photometric selection to match that of the surveys). A first remark that can be made is that the model predicts more stars far from the plane (see Fig. 12), and that the most distant stars in the actual dataset are metal-rich. This is a consequence of our adoption of a rejection criterion based on the relative error of the distance – by keeping only the targets with errors lower than 50% we inevitably reject the faintest, metal-poor stars. Given the fact that mostly dwarf foreground stars are observed, the rejected targets are hence also the most distant.
Furthermore, in the direction of the Sculptor line-of-sight, the comparison between the model and the data shows an excess in the number of observed metal-poor stars at 0.8 ≤ |Z| ≤ 2 kpc, the typical distances where the thick disc dominates. These stars exhibit a radial velocity distribution with a range of roughly 100 km s-1, broader than one would expect for the canonical thick disc, though similar to the value expected in that line-of-sight for the stellar halo. We note, however, that some of these stars might be contaminants from the Sculptor dSph, wrongly assigned to the foreground by an erroneous estimation of surface gravity (as seen from their radial velocities in the bottom-left plot of Fig. 11).
We used Kolmogorov-Smirnov tests to compute the probabilities of the null hypotheses that the modelled radial velocities and metallicities are drawn from the same distributions as the observed ones. As far as the radial velocities are concerned (see Fig. 12), the null hypothesis cannot be rejected for either of the two lines-of-sight, with a probability constantly higher than ~10%. In particular, in the case of the Sculptor line-of-sight (where Vrad ~ − VZ), this probability can reach values higher than 50%, depending on the Monte-Carlo realisations. As far as the observed metallicities in the Sculptor line-of-sight are concerned, the null hypothesis that the simulation comes from the same underlying distribution as the observed one is valid with a probability higher than ~10%. The agreement between the simulations and the observations for the Sextans line-of-sight is worse, with the probability of not rejecting the null hypothesis being less than 1%.
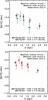 |
Fig. 13 Observed and predicted (black diamond symbols) metallicity gradients for the Sculptor (top) and Sextans (bottom) lines-of-sight. In each plot, the purple plus signs indicate the results obtained from the Besançon model, assuming zero errors on position and metallicity. |
In order to interpret how smoothly the thin/thick disc (and eventually the thick disc/halo) transition happens along the different directions, we computed the observed and predicted mean metallicities at different line-of-sight distances, D. Unfortunately, without any information for either the 3D velocities or the α-abundances, it is not possible to differentiate the different populations along the line-of-sight and hence investigate their individual intrinsic metallicity gradients. We note, however, that the positions of the stars can provide insight into the nature of the surveyed population. In the case of the Sculptor line-of-sight, for example, where D ~ Z, the thin disc is expected to dominate at distances closer than ~0.7 kpc, whereas towards the Sextans line-of-sight, the thin disc should still be dominant3 up to D ~ 1 kpc.
We made 5 × 10³ Monte-Carlo realisations for both the distances and the metallicities, assuming that the errors for those two parameters are independent and Gaussian, centred on the derived values and with standard deviation equal to the associated uncertainties. For each realisation we separated the stars in equally populated distance bins, and measured their median metallicity and distance. Figure 13 shows the mean values of the medians of the Monte-Carlo realisations, the associated error bars being the dispersion of the median values across realisations. Given these mean values and error bars, the metallicity gradients along the lines-of-sight have then been measured by fitting a slope using a least-mean-square method.
We found that the metallicity gradients along both directions are negative, as expected since the lines-of-sight are pointing towards the outer Galaxy and span relatively large distances far from the Galactic plane. The Sculptor line-of-sight has the steepest gradient, with = −0.22 ± 0.17 dex kpc-1, whereas towards the Sextans line-of-sight we found a gradient with amplitude −0.09 ± 0.13 dex kpc-1.
For both lines-of-sight, the predictions (represented in the Fig. 13 by black diamond symbols) are in a fair agreement with the observations. However, the simulations towards Sculptor show a slightly shallower metallicity gradient. This difference in this line-of-sight indicates either that the relative importance of the thick disc is higher than that predicted, or that the thick disc has an intrinsic vertical metallicity gradient. Nevertheless, given the large error bars, any intrinsic gradient should be rather small, i.e. less than − 0.10 dex kpc-1.
Finally, Fig. 14 shows, for the Sextans line-of-sight, the comparisons between the model and the observations for the  distribution (upper panel) and for the relation between and the metallicity (lower panel). It is clear that there is good agreement between the observed data and the predictions of the Besançon model. A KS-test indicates that both distributions are compatible, in the sense that the null hypothesis cannot be excluded with a probability of roughly ~5% (we note that within the Monte-Carlo realisations the probabilities of not rejecting the null hypothesis vary between 3% and 15%). We remind the reader that is not a good estimator of the azimuthal velocity for the Sculptor line-of-sight and hence no comparison with the model can be made in this direction.
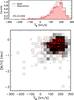 |
Fig. 14 Upper panel: comparison between the observed |
The general agreement between the observations and the model – which does not include any metallicity gradient for the thick disc, either radial or vertical – leads to the conclusion that the decrease in metallicity with Z-height that is measured can be explained as reflecting not an intrinsic gradient, but rather a smooth transition from a thin-disc dominated population to a thick-disc dominated population whose mean metallicity is around [M/H] ~ −0.6 dex and with a lag in orbital azimuthal velocity of ~50 km s-1. This result is in agreement with Cheng et al. (2012) who detected no radial metallicity gradient for the thick disc stars, based on their analysis of spectra from the SEGUE survey. We note, however, that the error bars of our measurements are such that a gradient with amplitude as small as that found by Carrell et al. (2012) (0.02 dex kpc-1, based on SDSS photometric data for FGK dwarf stars) would not be detectable. We conclude that a thick disc of constant mean metallicity and chemically symmetric relative to the Galactic plane, as is assumed in the Besançon model, provides an adequate description of the data in these two lines-of-sight.
4.3. The Carina line-of-sight: evidence of an accreted population or of the metal-weak thick disc?
The roughly good agreement between the observations and the Besançon model that is found for the lines-of-sight of Sculptor and Sextans, is not found in the case of the Carina line-of-sight, as it can be seen in Fig. 15. Indeed, for this lower Galactic latitude line-of-sight (b = −22.2°), the relative population distributions show that the model lacks a significant number of stars with metallicities lower than [M/H] < −1 dex, at distances closer than 1 kpc from the plane. In addition, not only does the model under-predict the population of metal-poor stars, it over-predicts the population of metal-rich stars at these distances. Further, the model over-predicts the number of stars of all metallicities at Z-distances greater than 1.5 kpc (top panel of Fig. 15).
It is unlikely that the Galactic warp could explain the difference between the model and the observations, since the data do not probe radial distance beyond 11 kpc, and the Galactic warp is expected to have an influence only at distances greater than 12 kpc (e.g. Momany et al. 2006). The mis-match between model and data can therefore be due to one of more of the following: the assumption of an incorrect value for the extinction; the presence of metallicity gradients in the thin disc (both radially and vertically), neglected in the model; the adoption in the model of an incorrect value for the relative normalisation of thick and thin discs; or, lastly, the presence of an extra population or structure, not included in the model, such as due to accretion or a moving group.
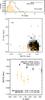 |
Fig. 15 Upper panel: comparison of | Z |-distance distribution between the observations towards the Carina line-of-sight and the Besançon model. Middle panel: metallicity versus distance above the Galactic plane for both the observed stars (orange filled circles) and simulated stars from the Besançon model. Lower panel: derived metallicity gradients. The purple plus signs indicate the results obtained from the Besançon model, assuming zero errors on position and metallicity. |
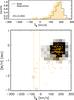 |
Fig. 16 Upper panel: comparison between the derived |
Figure 16 is similar to Fig. 14 but for the line-of-sight of Carina. It is apparent that the difference in the azimuthal velocity distribution is not simply a zero-point offset, but, as seen on the lower panel of Fig. 16, reflects the absence in the models of the low metallicity population that is observed relatively close to the Galactic plane. This conclusion is supported by K-S tests on the line-of-sight and azimuthal velocities distributions which exclude the null hypothesis that the simulations come from the same underlying distribution as do the observations. The vertical dashed lines in the lower panel of Fig. 16 correspond to the expected range for stars of the background Carina dSph; contamination of the sample by background stars should not be important.
This low-metallicity population appears to be confined close to the plane. We investigated it further by selecting all stars for which we derived both a metallicity lower than − 0.9 dex and a Z-distance smaller than 0.75 kpc. The distribution of the projected azimuthal velocity () for these stars is shown in Fig. 17 (as shown in the bottom panel of Fig. 9, this a good estimator of the true orbital azimuthal velocity). The distribution peaks at ~120 km s-1, well below the value of the thin disc ( km s-1), and also below that of the canonical thick disc (Vφ ~ 170 km s-1) but above the mean expected for the stellar halo (Vφ ~ 0 km s-1). The measured velocity dispersion (80 km s-1) is also intermediate between the expected value of the halo (~100 km s-1) and that of the canonical thick disc (~50 km s-1). These kinematic properties of this population are in good agreement with the findings of Wyse et al. (2006), who analysed the same dataset and identified an “extra” component. We note however that unlike Wyse et al. (2006), in the present analysis we have derived precise distance estimations (| Z | < 1 kpc) and metallicity measurements ([M/H] < − 1 dex) and thus can make a more robust characterisation of this population.
The kinematic characteristics of these stars, combined with the low value of their mean metallicity (~− 1.5 dex, typical of stars in the stellar halo or in dSph) indicate that this population does not belong to the canonical thick disc. However, their locations, close to the Galactic plane, argue against membership of these stars in the stellar halo. Further, both the position and the metallicity of this extra population rule out the possibilities that the disagreement between the model and the observations is caused purely by either the adoption of an erroneous value for the interstellar extinction in our analysis or by different radial and/or vertical metallicity gradients than those assumed in the Besançon model (see, for example, Rudolph et al. 2006; Pedicelli et al. 2009; Gazzano et al. 2013, for values of radial metallicity gradients in the thin disc ranging from − 0.046 dex kpc-1 to − 0.085 dex kpc-1). Indeed, we found good agreement between the model predictions and our observational data, other than the presence of this set of low angular momentum stars only in the observations. This is demonstrated in Fig. 18, which shows the analogues of the lower panels of Figs. 15 and 16, but now with the members of the extra population removed from the observed dataset. We proceeded by first excluding these stars from the dataset and recomputing an appropriate simulated catalogue from the Besançon model. We then derived the metallicity gradients, given 5 × 10³ Monte-Carlo realisations. As seen in Fig. 18, the agreement is much improved, especially for the closest stars, with the versus [M/H] distribution similar to that predicted by the model4. In addition, the new normalisation of the model in the different magnitude bins removes the over-prediction of stars far from the plane (see upper panels of Fig. 15). We note that even after pruning the sample, the derived metallicity gradient from the observations is still steeper than the predicted one.
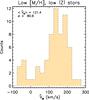 |
Fig. 17 Azimuthal velocity estimator for the stars towards the Carina line-of-sight that have both low metallicity and are located close to the Galactic plane (not predicted by the Besançon model). The histogram has a peak at |

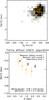 |
Fig. 18 Observed and predicted gradients for the Carina line-of-sight, without the low-altitude, low metallicity stars of Fig. 17 ( dex and | Z | < 0.75 kpc). The purple plus signs indicate the results obtained from a Besançon model without any errors on the positions nor the metallicity. |
5. Discussion: accreted population, metal-weak thick disc or moving group?
Moving groups, localised in phase space and metallicity have their origin from disrupted star clusters, satellite accretion or due to resonances between disc stars and the Galactic bar and/or transient spiral arms (Antoja et al. 2010). In the case of disrupted stellar clusters, the stars composing the moving group are usually young, with typical ages of less than 1 Gyr. It hence seems unlikely, given the low metallicity and the relatively wide (1 dex) metallicity range of the stars we have identified in this population along the Carina line-of-sight, that this origin could be viable.
On the other hand, a moving group with old ages (in order to be compatible with metallicities lower than –1 dex) can be produced from the resonances between the spiral arms and the Galactic bar. Nevertheless, it is unlikely that a moving group with such an high azimuthal velocity dispersion would have formed. Indeed, in order for a group of stars to migrate outwards, similar velocities are required, in order to be simultaneously in resonance with the Galactic bar and the spiral arms.
An alternative explanation was proposed by Gilmore et al. (2002) and Wyse et al. (2006). These authors have argued that in the general framework of thick-disc formation through heating of a pre-existing thin disc by accretion of a massive satellite galaxy at a redshift z ~ 2, stellar debris from the satellite would likely be of low metallicity and on intermediate angular momentum orbits. In that case, the fact that these stars are not observed towards the other line-of-sight of Sextans and Sculptor could be due to the initial orbit of the satellite and peri-centre passage at which the observed stars were removed from the satellite. Nevertheless, this argument seems to be refuted by the fact that Kordopatis et al. (2011b), who observed towards (l,b) = (277°,47°), did not find any evidence of such a population, despite the fact that distances up to 5−6 kpc above the plane were covered. In addition, the azimuthal velocity dispersion of the extra population seems too high for a localised stellar stream, further challenging this scenario. We note, however, that Mizutani et al. (2003) have suggested that a putative dwarf spheroidal progenitor of ω-Cen could have deposited debris with similar low angular momentum and metallicity.
Finally, this population could be related to the metal-weak thick disc (MWTD). The existence of such a metal-poor tail for the thick disc has already been discussed in Morrison et al. (1990), Chiba & Beers (2000), Carollo et al. (2010), Ruchti et al. (2011) and represents an additional component associated with the canonical thick disc, extending to metallicities as low as − 2 dex. The extra population identified in this study has a mean metallicity of ~− 1.4 dex and mean 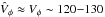 km s-1. Assuming that the canonical thick disc has a mean metallicity of − 0.5 dex and a mean Vφ ~ 170 km s-1, this would imply that the MWTD component that we observed follows the proposed Spagna et al. (2010), Kordopatis et al. (2011b), Lee et al. (2011) orbital rotation-metallicity correlation of km s-1 dex-1. Following this line of argument, the extra population is simply the metal-poor tail of the canonical thick disc.
The question then arises as to why we do not observe this MWTD population towards the other Galactic directions. One obvious reason could be possible substructure within the thick disc. Moreover, the Carina line-of-sight is at a lower Galactic latitude and thus has a longer path length through the thick disc which should lead to a larger number of foreground stars, consequently detecting more stars belonging to the metal-weak tail of the thick disc. Indeed, assuming no variation in the scale-height of the thick disc for the probed Galactocentric radii, the Carina line-of-sight should pass through ~1.8 times more thick disc stars than the Sextans line-of-sight, and ~2.6 times more thick disc stars than the Sculptor line-of-sight (as determined by the ratio of the sine of their Galactic latitudes). It is hence possible that the MWTD would not have been detected in the other line-of-sight due to small number statistics.
In order to further investigate this possibility, we first assume that the contribution of the stellar halo can be neglected in both the lines-of-sight of Carina and Sextans, and compute the ratio of the number of candidate MWTD stars ([M/H]< − 1.05 dex, | Z | < 2 kpc) to the total number of thick disc stars ([M/H]< −0.5 dex, | Z | < 2 kpc). This gives roughly 28% (26 stars out of 92) and 13% (7 stars out of 52) of the targets belong to the MWTD, towards the Carina and Sextans line-of-sight, respectively. These numbers are in good agreement, after multiplying the result for the Sextans line-of-sight by the corrector factor of 1.78 due to the different latitudes. It hence seems plausible to argue that the Sextans line-of-sight has a similar proportion of MWTD stars, which have barely been observed due to the low normalisation of the metal-weak tail of the thick disc.
The contribution of the stellar halo cannot be neglected for the Sculptor line-of-sight since in this direction the foreground stars are at larger distances from the plane compared to the other lines-of-sight. Indeed, a similar star-count ratio as in the other lines-of-sight, based on just the metallicities and assuming entirely thick disc, would indicate that roughly 40% (22 stars out of 55) should belong to the MWTD. Unfortunately, without the azimuthal velocity, halo stars are difficult to disentangle from the rest of the Galactic components. However, in this line-of-sight the radial velocity is a good proxy for the vertical velocity, VZ, and this may be used as a basis for separation of the thick disc from the halo. Adopting the criterion that thick disc stars have | Vrad | < 50 km s-1, the MWTD fraction drops to ~25%, indicating that indeed a considerable number of halo stars contaminates the sample towards this line-of-sight.
6. Conclusions
We have taken advantage of spectroscopic surveys that aimed to study member stars in four dwarf spheroidal galaxies (Fornax, Sculptor, Sextans and Carina) to instead study stars of the Milky Way Galaxy, observed serendipitously as foreground “contaminants” in the sample. We selected the last three directions and extracted the foreground stars in order to investigate the chemical properties of our Galaxy towards the outer discs.
We ran the medium-resolution spectra through an automated pipeline in order to derive estimated values for the stellar atmospheric parameters and then we projected the output on theoretical isochrones, to infer the stellar line-of-sight distances. We compared the observational results with the predictions of the Besançon Galactic model (Robin et al. 2003) and showed that towards the directions of Sculptor and Sextans, the decreases in mean metallicity with distance that were found are consistent with zero intrinsic vertical and radial metallicity gradients in the thick disc, reflecting rather the change in population mix (thin disc – thick disc) with distance.
Furthermore, we confirmed the existence of an unpredicted extra population towards the line-of-sight of Carina, previously proposed by Wyse et al. (2006). This population is observed close to the plane (|Z| < 1 kpc), has a mean metallicity around ~−1.4 dex, and an intermediate mean azimuthal velocity (Vφ ~ 120 km s-1). It follows the well established correlation between the metallicity and the azimuthal orbital velocity of thick-disc stars, and hence is likely to be associated with the metal-weak thick disc. We note, however, that future tests will need to involve 3D kinematics (incorporating proper motions) in order to derive the velocity ellipsoid of these stars, and estimate their scale-length and scale-height. This will allow a more comprehensive comparison between this extra population and the canonical thick disc, and hence establish more robustly if it is indeed the metal-poor tail of the canonical thick disc or a different component.
Finally, we showed that if we remove this extra population from our analysis of the data towards Carina, then the Besançon model – which assumes no gradients in the metallicity distribution of the thick disc – agrees, within the errors, with the observations, as it did towards the two other studied lines-of-sight. This result implies that the thick disc has approximately constant mean metallicity, at least within several kpc of the Sun, above and below the Galactic plane.
Acknowledgments
J. E. Norris is warmly thanked for his careful reading of the manuscript and his useful comments. The anonymous referee is also thanked for helping us improve the the quality of our paper. RFGW acknowledges support from National Science Foundation grants AST-0908326 and CDI-1124403. E.S. gratefully acknowledges the Canadian Institute for Advanced Research (CIfAR) Global Scholar Academy and the Canadian Institute for Theoretical Astrophysics (CITA) National Fellowship for support. G. B. gratefully acknowledges support through a Marie-Curie action Intra European Fellowship, funded from the European Union Seventh Framework Program (FP7/2007-2013) under grant agreement number PIEFGA-2010-274151.
References
- Abadi, M. G., Navarro, J. F., Steinmetz, M., & Eke, V. R. 2003, ApJ, 597, 21 [NASA ADS] [CrossRef] [MathSciNet] [Google Scholar]
- Antoja, T., Figueras, F., Torra, J., Valenzuela, O., & Pichardo, B. 2010, Lecture Notes and Essays in Astrophysics, 4, 13 [NASA ADS] [Google Scholar]
- Battaglia, G., & Starkenburg, E. 2012, A&A, 539, A123 [NASA ADS] [CrossRef] [EDP Sciences] [Google Scholar]
- Battaglia, G., Tolstoy, E., Helmi, A., et al. 2006, A&A, 459, 423 [NASA ADS] [CrossRef] [EDP Sciences] [Google Scholar]
- Battaglia, G., Irwin, M., Tolstoy, E., et al. 2008, MNRAS, 383, 183 [NASA ADS] [CrossRef] [MathSciNet] [Google Scholar]
- Battaglia, G., Tolstoy, E., Helmi, A., et al. 2011, MNRAS, 411, 1013 [NASA ADS] [CrossRef] [MathSciNet] [Google Scholar]
- Bensby, T., Feltzing, S., Lundström, I., & Ilyin, I. 2005, A&A, 433, 185 [NASA ADS] [CrossRef] [EDP Sciences] [Google Scholar]
- Bensby, T., Zenn, A. R., Oey, M. S., & Feltzing, S. 2007, ApJ, 663, L13 [CrossRef] [Google Scholar]
- Bijaoui, A., Recio-Blanco, A., de Laverny, P., & Ordenovic, C. 2012, Statistical methodology, 9, 55 [Google Scholar]
- Brook, C., Richard, S., Kawata, D., Martel, H., & Gibson, B. K. 2007, ApJ, 658, 60 [NASA ADS] [CrossRef] [Google Scholar]
- Burnett, B., & Binney, J. 2010, MNRAS, 407, 339 [NASA ADS] [CrossRef] [Google Scholar]
- Carollo, D., Beers, T. C., Chiba, M., et al. 2010, ApJ, 712, 692 [NASA ADS] [CrossRef] [Google Scholar]
- Carrell, K., Chen, Y., & Zhao, G. 2012, AJ, 144, 185 [NASA ADS] [CrossRef] [Google Scholar]
- Casagrande, L., Ramírez, I., Meléndez, J., Bessell, M., & Asplund, M. 2010, A&A, 512, A54 [NASA ADS] [CrossRef] [EDP Sciences] [Google Scholar]
- Chen, Y. Q., Zhao, G., Carrell, K., & Zhao, J. K. 2011, AJ, 142, 184 [NASA ADS] [CrossRef] [Google Scholar]
- Cheng, J. Y., Rockosi, C. M., Morrison, H. L., et al. 2012, ApJ, 746, 149 [NASA ADS] [CrossRef] [Google Scholar]
- Chiba, M., & Beers, T. C. 2000, AJ, 119, 2843 [NASA ADS] [CrossRef] [Google Scholar]
- de Jong, J. T. A., Yanny, B., Rix, H.-W., et al. 2010, ApJ, 714, 663 [NASA ADS] [CrossRef] [Google Scholar]
- Demarque, P., Woo, J.-H., Kim, Y.-C., & Yi, S. K. 2004, ApJS, 155, 667 [NASA ADS] [CrossRef] [Google Scholar]
- Fuhrmann, K. 2008, MNRAS, 384, 173 [NASA ADS] [CrossRef] [Google Scholar]
- Gazzano, J.-C., Kordopatis, G., Deleuil, M., et al. 2013, A&A, 550, A125 [NASA ADS] [CrossRef] [EDP Sciences] [Google Scholar]
- Gilmore, G., & Reid, N. 1983, MNRAS, 202, 1025 [NASA ADS] [CrossRef] [Google Scholar]
- Gilmore, G., & Wyse, R. F. G. 1985, AJ, 90, 2015 [NASA ADS] [CrossRef] [Google Scholar]
- Gilmore, G., Wyse, R. F. G., & Jones, J. B. 1995, AJ, 109, 1095 [NASA ADS] [CrossRef] [Google Scholar]
- Gilmore, G., Wyse, R. F. G., & Norris, J. E. 2002, ApJ, 574, L39 [NASA ADS] [CrossRef] [Google Scholar]
- Gilmore, G., Randich, S., Asplund, M., et al. 2012, The Messenger, 147, 25 [NASA ADS] [Google Scholar]
- Girard, T. M., Korchagin, V. I., Casetti-Dinescu, D. I., et al. 2006, AJ, 132, 1768 [NASA ADS] [CrossRef] [Google Scholar]
- Irwin, M., & Hatzidimitriou, D. 1995, MNRAS, 277, 1354 [NASA ADS] [CrossRef] [Google Scholar]
- Jurić, M., Ivezić, Ž., Brooks, A., et al. 2008, ApJ, 673, 864 [NASA ADS] [CrossRef] [MathSciNet] [Google Scholar]
- Koch, A., Grebel, E. K., Wyse, R. F. G., et al. 2006, AJ, 131, 895 [NASA ADS] [CrossRef] [Google Scholar]
- Kordopatis, G., Recio-Blanco, A., de Laverny, P., et al. 2011a, A&A, 535, A106 [NASA ADS] [CrossRef] [EDP Sciences] [Google Scholar]
- Kordopatis, G., Recio-Blanco, A., de Laverny, P., et al. 2011b, A&A, 535, A107 [NASA ADS] [CrossRef] [EDP Sciences] [Google Scholar]
- Lee, Y. S., Beers, T. C., An, D., et al. 2011, ApJ, 738, 187 [NASA ADS] [CrossRef] [Google Scholar]
- Lejeune, T., Cuisinier, F., & Buser, R. 1998, A&AS, 130, 65 [NASA ADS] [CrossRef] [EDP Sciences] [Google Scholar]
- Loebman, S. R., Roškar, R., Debattista, V. P., et al. 2011, ApJ, 737, 8 [NASA ADS] [CrossRef] [Google Scholar]
- Mishenina, T. V., Bienaymé, O., Gorbaneva, T. I., et al. 2006, A&A, 456, 1109 [NASA ADS] [CrossRef] [EDP Sciences] [Google Scholar]
- Misiriotis, A., Xilouris, E. M., Papamastorakis, J., Boumis, P., & Goudis, C. D. 2006, A&A, 459, 113 [NASA ADS] [CrossRef] [EDP Sciences] [Google Scholar]
- Mizutani, A., Chiba, M., & Sakamoto, T. 2003, ApJ, 589, L89 [NASA ADS] [CrossRef] [Google Scholar]
- Momany, Y., Zaggia, S., Gilmore, G., et al. 2006, A&A, 451, 515 [NASA ADS] [CrossRef] [EDP Sciences] [Google Scholar]
- Morrison, H. L., Flynn, C., & Freeman, K. C. 1990, AJ, 100, 1191 [NASA ADS] [CrossRef] [Google Scholar]
- Pedicelli, S., Bono, G., Lemasle, B., et al. 2009, A&A, 504, 81 [NASA ADS] [CrossRef] [EDP Sciences] [Google Scholar]
- Ramírez, I., & Meléndez, J. 2005, ApJ, 626, 465 [NASA ADS] [CrossRef] [Google Scholar]
- Recio-Blanco, A., Bijaoui, A., & de Laverny, P. 2006, MNRAS, 370, 141 [NASA ADS] [CrossRef] [Google Scholar]
- Reddy, B. E., Lambert, D. L., & Allen de Prieto, C. 2006, MNRAS, 367, 1329 [NASA ADS] [CrossRef] [Google Scholar]
- Reid, M. J. 1993, ARA&A, 31, 345 [NASA ADS] [CrossRef] [Google Scholar]
- Rix, H.-W., & Bovy, J. 2013, A&ARv, 21, 61 [NASA ADS] [CrossRef] [Google Scholar]
- Robin, A. C., Reylé, C., Derrière, S., & Picaud, S. 2003, A&A, 409, 523 [NASA ADS] [CrossRef] [EDP Sciences] [Google Scholar]
- Ruchti, G. R., Fulbright, J. P., Wyse, R. F. G., et al. 2011, ApJ, 737, 9 [NASA ADS] [CrossRef] [Google Scholar]
- Rudolph, A. L., Fich, M., Bell, G. R., et al. 2006, ApJS, 162, 346 [NASA ADS] [CrossRef] [Google Scholar]
- Schlegel, D. J., Finkbeiner, D. P., & Davis, M. 1998, ApJ, 500, 525 [NASA ADS] [CrossRef] [Google Scholar]
- Schlesinger, K. J., Johnson, J. A., Rockosi, C. M., et al. 2012, ApJ, 761, 160 [NASA ADS] [CrossRef] [Google Scholar]
- Soubiran, C., Bienaymé, O., & Siebert, A. 2003, A&A, 398, 141 [NASA ADS] [CrossRef] [EDP Sciences] [Google Scholar]
- Spagna, A., Lattanzi, M. G., Re Fiorentin, P., & Smart, R. L. 2010, A&A, 510, L4 [NASA ADS] [CrossRef] [EDP Sciences] [Google Scholar]
- Steinmetz, M., Zwitter, T., Siebert, A., et al. 2006, AJ, 132, 1645 [NASA ADS] [CrossRef] [Google Scholar]
- Tolstoy, E., Hill, V., Irwin, M., et al. 2006, The Messenger, 123, 33 [NASA ADS] [Google Scholar]
- Tolstoy, E., Hill, V., & Tosi, M. 2009, ARA&A, 47, 371 [NASA ADS] [CrossRef] [Google Scholar]
- van der Kruit, P. C., & Freeman, K. C. 2011, ARA&A, 49, 301 [NASA ADS] [CrossRef] [Google Scholar]
- Villalobos, Á., & Helmi, A. 2008, MNRAS, 391, 1806 [NASA ADS] [CrossRef] [Google Scholar]
- Wyse, R. F. G., Gilmore, G., Norris, J. E., et al. 2006, ApJ, 639, L13 [NASA ADS] [CrossRef] [Google Scholar]
- Yanny, B., Rockosi, C., Newberg, H. J., et al. 2009, AJ, 137, 4377 [NASA ADS] [CrossRef] [Google Scholar]
- Yoachim, P., & Dalcanton, J. J. 2008, ApJ, 682, 1004 [NASA ADS] [CrossRef] [Google Scholar]
- York, D. G., Adelman, J., Anderson, Jr., J. E., et al. 2000, AJ, 120, 1579 [Google Scholar]
- Zwitter, T., Siebert, A., Munari, U., et al. 2008, AJ, 136, 421 [NASA ADS] [CrossRef] [Google Scholar]
All Tables
Positions, radial velocities, magnitudes, and distances of the selected foreground stars.
All Figures
|
Fig. 1 Aitoff projection of the Galactic coordinates of the targets. The lines-of-sight of Sculptor, Sextans, Fornax and Carina are represented in green, red, blue and orange colours, respectively. The positions of other dwarf galaxies, including ultra faint dwarfs, have also been indicated. |
| In the text | |
|
Fig. 2 Effective temperature (Teff) – surface gravity (log g) diagram representing the parameters measured by the pipeline. The foreground stars corresponding to the line-of-sight of Sculptor are represented in green, the ones towards Sextans in red, towards Fornax in blue and towards Carina in orange. The background extragalactic stars, as selected in Sect. 3.2, are represented in grey open circles. |
| In the text | |
|
Fig. 3 Comparison of the internal uncertainties (in red) with the 70th percentile of the dispersion distribution of the repeated observations of dwarf stars more metal rich than [M/H] ~ − 1.25 dex for Teff (top), log g (middle) and [M/H] (bottom). |
| In the text | |
|
Fig. 4 Radial velocity versus overall metallicity for all the lines-of-sight. The colour coding is the same as in Fig. 2. Typical internal uncertainties, at different metallicity regimes, and for the whole dataset (including the faint extra-galactic stars plotted as grey empty circles) are represented in the left part of the plots. The dotted vertical lines represent for each line-of-sight the adopted radial velocity range of the stars belonging to each dwarf spheroidal galaxy. |
| In the text | |
|
Fig. 5 Radial velocity versus surface gravity, using the results from the parameterisation pipeline (upper panel) and those projected on the Yonsei-Yale isochrones (lower panel). Open symbols correspond to the targets that have the same velocity as the dSph in their line-of-sight and have a projected (log) surface gravity less than 3.75 cm s-2. |
| In the text | |
|
Fig. 6 Effective temperature (Teff) – surface gravity (log g) diagram using the parameter values obtained after projection onto isochrones (see Sect. 3.1), for all the observed targets of the DART and Carina surveys. For each line-of-sight, the filled symbols correspond to the foreground stars that are considered in this study, while the open grey circles are the dSph members. |
| In the text | |
|
Fig. 7 V-magnitude versus derived line-of-sight distance for the foreground stars, as derived by our pipeline (in a logarithmic scale). The errors in the distances are as indicated. |
| In the text | |
|
Fig. 8 Absolute distance above the Galactic plane (Z) versus the Galactocentric radial distance (R⊙ = 8 kpc) for the foreground stars. The colour code goes from blue for the most metal-poor stars to red for the most metal-rich. The pencil beams, from left to right, correspond to the lines-of-sight of Sculptor, Fornax, Sextans and Carina, respectively. The median error for the entire foreground dataset is represented at the lower right corner. |
| In the text | |
|
Fig. 9 True azimuthal velocity Vφ (dashed histograms) computed from simulations of the Besançon model and the estimator |
| In the text | |
|
Fig. 10 V–magnitude versus (V − I) colour for the foreground data (coloured circles) and the biased Besançon models (shown in grey-scale in each panel). The simulated samples follow the same V and (V − I) distributions as the selected observed stars. |
| In the text | |
|
Fig. 11 Position above the Galactic plane (middle panels) and radial velocity (bottom panels) versus metallicity for the observations (in green for the Sculptor line-of-sight on the left-hand side and red for the Sextans line-of-sight on the right-hand side). The predictions of the Besançon model are shown in grey-scale. The horizontal dashed lines indicate the range of radial velocities appropriate for member stars of the respective dSph. The panels at the very top show the metallicity distributions of the foreground stars in these two lines-of-sight and the Kolmogorov-Smirnov probability of not rejecting the null hypothesis. |
| In the text | |
|
Fig. 12 Comparisons of the histograms of the simulated catalogue and the observations towards the line-of-sight of Sculptor (upper panel) and the line-of-sight of Sextans (lower panel). The Kolmogorov-Smirnov probability of not rejecting the null hypothesis is written in the right side of each histogram, and is representative of a single Monte-Carlo realisation. |
| In the text | |
|
Fig. 13 Observed and predicted (black diamond symbols) metallicity gradients for the Sculptor (top) and Sextans (bottom) lines-of-sight. In each plot, the purple plus signs indicate the results obtained from the Besançon model, assuming zero errors on position and metallicity. |
| In the text | |
|
Fig. 14 Upper panel: comparison between the observed |
| In the text | |
|
Fig. 15 Upper panel: comparison of | Z |-distance distribution between the observations towards the Carina line-of-sight and the Besançon model. Middle panel: metallicity versus distance above the Galactic plane for both the observed stars (orange filled circles) and simulated stars from the Besançon model. Lower panel: derived metallicity gradients. The purple plus signs indicate the results obtained from the Besançon model, assuming zero errors on position and metallicity. |
| In the text | |
|
Fig. 16 Upper panel: comparison between the derived |
| In the text | |
|
Fig. 17 Azimuthal velocity estimator for the stars towards the Carina line-of-sight that have both low metallicity and are located close to the Galactic plane (not predicted by the Besançon model). The histogram has a peak at |
| In the text | |
|
Fig. 18 Observed and predicted gradients for the Carina line-of-sight, without the low-altitude, low metallicity stars of Fig. 17 ( dex and | Z | < 0.75 kpc). The purple plus signs indicate the results obtained from a Besançon model without any errors on the positions nor the metallicity. |
| In the text | |
Current usage metrics show cumulative count of Article Views (full-text article views including HTML views, PDF and ePub downloads, according to the available data) and Abstracts Views on Vision4Press platform.
Data correspond to usage on the plateform after 2015. The current usage metrics is available 48-96 hours after online publication and is updated daily on week days.
Initial download of the metrics may take a while.