Fig. 16
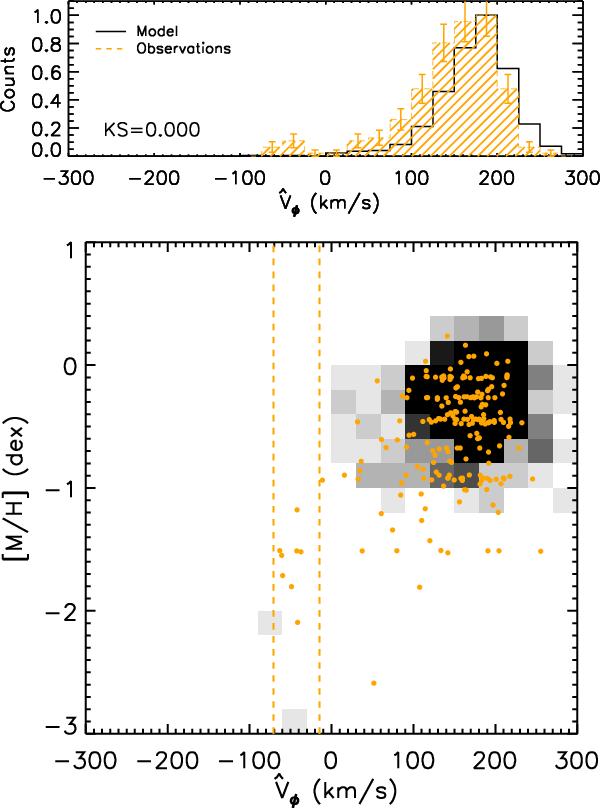
Upper panel: comparison between the derived  distribution of the observed sample with that predicted by the Besançon model for the Carina line-of-sight. Lower panel: versus metallicity for the observations (filled orange circles) and for the Besançon model. The vertical dashed lines indicate the expected range for true members of the Carina dSph.
Current usage metrics show cumulative count of Article Views (full-text article views including HTML views, PDF and ePub downloads, according to the available data) and Abstracts Views on Vision4Press platform.
Data correspond to usage on the plateform after 2015. The current usage metrics is available 48-96 hours after online publication and is updated daily on week days.
Initial download of the metrics may take a while.