Free Access
Fig. 10
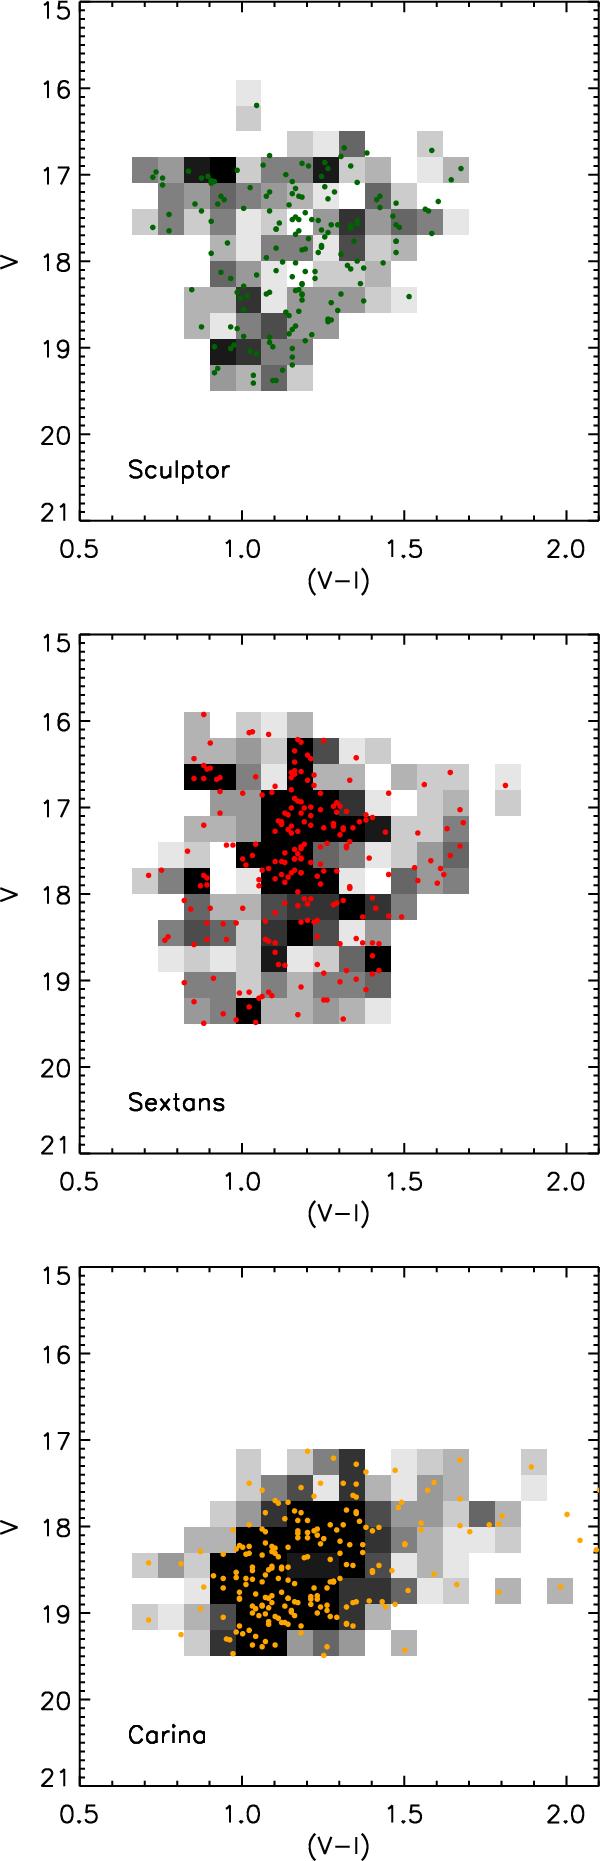
V–magnitude versus (V − I) colour for the foreground data (coloured circles) and the biased Besançon models (shown in grey-scale in each panel). The simulated samples follow the same V and (V − I) distributions as the selected observed stars.
Current usage metrics show cumulative count of Article Views (full-text article views including HTML views, PDF and ePub downloads, according to the available data) and Abstracts Views on Vision4Press platform.
Data correspond to usage on the plateform after 2015. The current usage metrics is available 48-96 hours after online publication and is updated daily on week days.
Initial download of the metrics may take a while.