Fig. 5
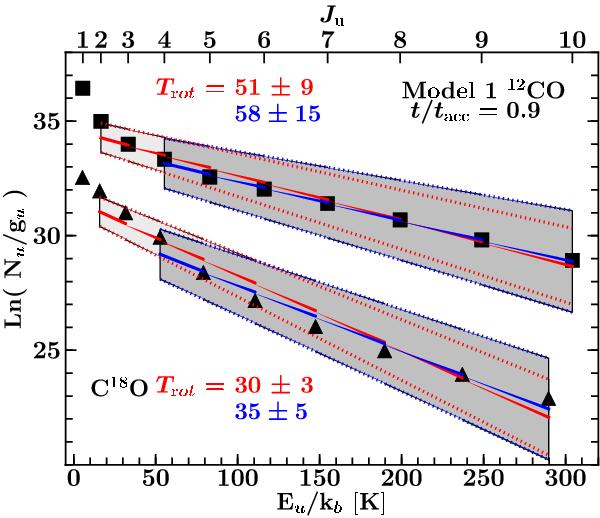
Examples of single-temperature fits through the 12CO (squares) and C18O (triangles) lines obtained from Model 1 fluxes at t/tacc = 0.9 in a 9′′ beam. The red line shows the linear fit from Ju = 2 up to Ju = 10 while the blue line is the fit up starting from Ju = 4 up to Ju = 10. The gray shaded regions indicate one standard deviation from the best fit.
Current usage metrics show cumulative count of Article Views (full-text article views including HTML views, PDF and ePub downloads, according to the available data) and Abstracts Views on Vision4Press platform.
Data correspond to usage on the plateform after 2015. The current usage metrics is available 48-96 hours after online publication and is updated daily on week days.
Initial download of the metrics may take a while.