Fig. C.3
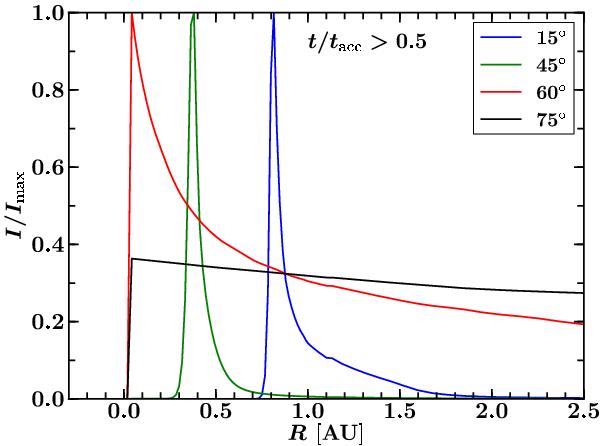
Normalized continuum flux without the stellar photosphere as function of distance from the center along one direction. The figure is constructed from a NIR image of Model 1 at t/tacc = 0.7 as an example. The general trend is similar for t/tacc > 0.5 independent of evolutionary models. The normalized continuum is similar for the various evolutionary models for t/tacc > 0.5. The continuum is shown to arise in the inner few AU region and to fall off very quickly for i < 60°. However, significant contributions from larger radii are expected for relatively high inclination.
Current usage metrics show cumulative count of Article Views (full-text article views including HTML views, PDF and ePub downloads, according to the available data) and Abstracts Views on Vision4Press platform.
Data correspond to usage on the plateform after 2015. The current usage metrics is available 48-96 hours after online publication and is updated daily on week days.
Initial download of the metrics may take a while.