Free Access
Fig. A.2
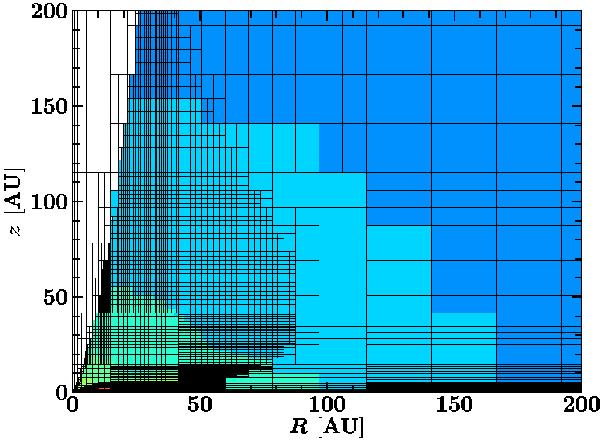
Example of the gridding used in the Stage 0 phase to resolve the small extent of the outflow cavity and to resolve the density and velocity gradient from the disk midplane to the envelope. The color contours are the same as in Fig. A.1. The structure shown is for Model 1 at t/tacc = 0.13.
Current usage metrics show cumulative count of Article Views (full-text article views including HTML views, PDF and ePub downloads, according to the available data) and Abstracts Views on Vision4Press platform.
Data correspond to usage on the plateform after 2015. The current usage metrics is available 48-96 hours after online publication and is updated daily on week days.
Initial download of the metrics may take a while.