Fig. 13
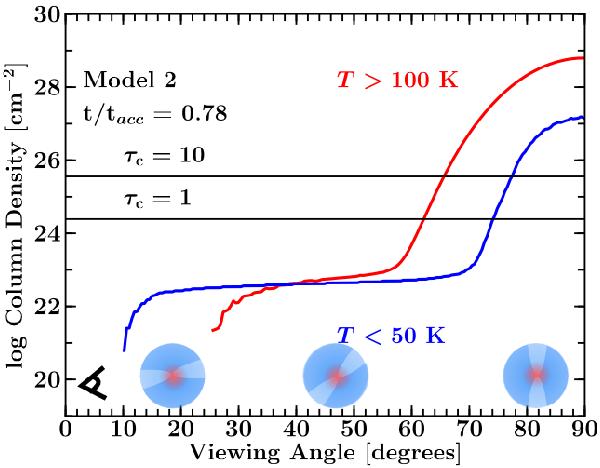
Integrated gas column density along the different viewing angles for Model 2. The red and blues lines indicate the warm (T > 100 K) and cold gas (T < 50 K), respectively. The approximate continuum optical depths, τc = 1 and 10, are also shown to indicate the amount material that is missed by properly solving the radiative transfer equation.
Current usage metrics show cumulative count of Article Views (full-text article views including HTML views, PDF and ePub downloads, according to the available data) and Abstracts Views on Vision4Press platform.
Data correspond to usage on the plateform after 2015. The current usage metrics is available 48-96 hours after online publication and is updated daily on week days.
Initial download of the metrics may take a while.