Free Access
Fig. 12
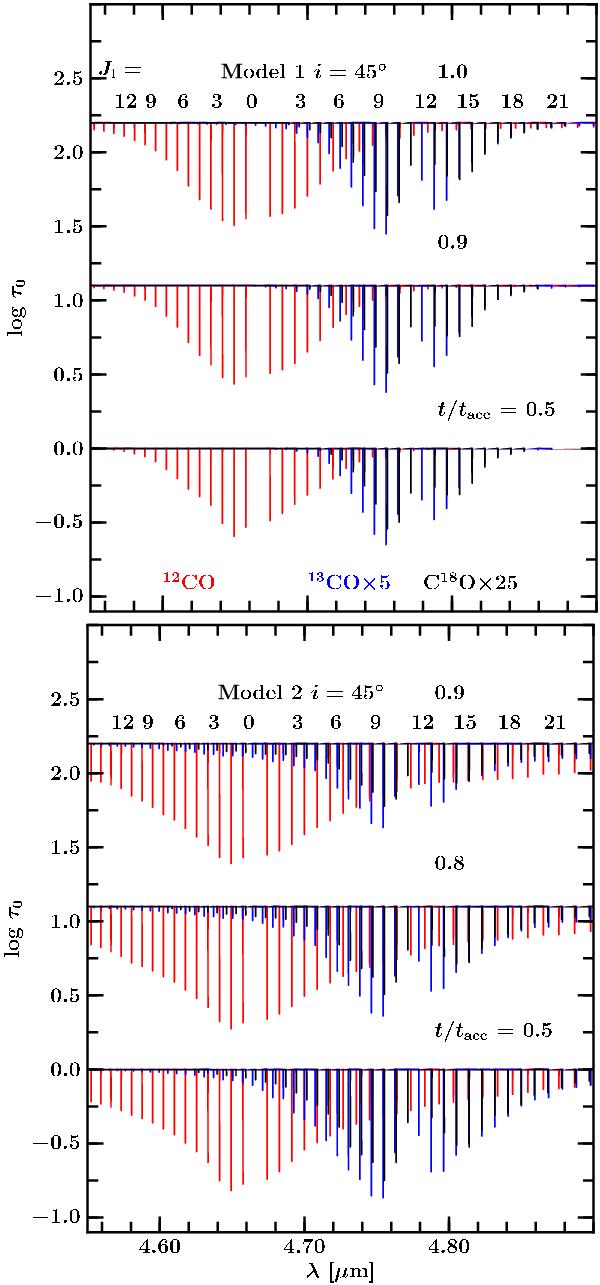
Evolution of the 12CO (red), 13CO (blue) and C18O (black) absorption lines for Model 1 at i = 45°. The evolution of the absorption lines for Model 2 is shown at the bottom panel. The lower rotational levels are indicated on top of the first spectrum. All of the 13CO lines are multiplied by 5 and C18O lines by 25.
This figure is made of several images, please see below:
Current usage metrics show cumulative count of Article Views (full-text article views including HTML views, PDF and ePub downloads, according to the available data) and Abstracts Views on Vision4Press platform.
Data correspond to usage on the plateform after 2015. The current usage metrics is available 48-96 hours after online publication and is updated daily on week days.
Initial download of the metrics may take a while.