| Issue |
A&A
Volume 555, July 2013
|
|
|---|---|---|
| Article Number | A151 | |
| Number of page(s) | 9 | |
| Section | Stellar structure and evolution | |
| DOI | https://doi.org/10.1051/0004-6361/201220819 | |
| Published online | 17 July 2013 | |
SGR 0418+5729, Swift J1822.3-1606, and 1E 2259+586 as massive, fast-rotating, highly magnetized white dwarfs
Dipartimento di Fisica and ICRASapienza Università di Roma,
P.le Aldo Moro 5, Rome 00185, Italy ICRANet, P.zza
della Repubblica 10,
Pescara
65122,
Italy
e-mail:
This email address is being protected from spambots. You need JavaScript enabled to view it.
Received:
29
November
2012
Accepted:
29
May
2013
Abstract
Aims. We describe the so-called low magnetic field magnetars, SGR 0418+5729, Swift J1822.3-1606, and the AXP prototype 1E 2259+586 as massive, fast-rotating, highly magnetized white dwarfs.
Methods. We give bounds for the mass, radius, moment of inertia, and magnetic field for these sources by requesting the stability of realistic, general relativistic, uniformly rotating white dwarfs. We also present the theoretical expectation of the infrared, optical, and ultraviolet emission of these objects and show their consistency with the current available observational data.
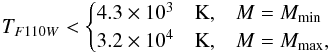
Results. We improve the theoretical prediction of the lower limit of the spindown rate of SGR 0418+5729; for a white dwarf close to its maximum stable mass we obtain the very stringent interval for the spindown rate of 4.1 × 10⁻¹⁶ < Ṗ < 6 × 10-15, where the upper value is the known observational limit. A lower limit has been also set for Swift J1822.3-1606, whose spindown rate is not yet fully confirmed. Our model provides for the source Ṗ ≥ 2.13 × 10⁻¹⁵ if the star is close to its maximum stable mass. We give in addition the frequencies at which absorption features could be present in the spectrum of these sources as the result of the scattering of photons with the quantized electrons by the surface magnetic field.
Key words: stars: magnetic field / stars: rotation / white dwarfs / stars: magnetars
© ESO, 2013
1. Introduction
Soft gamma-ray repeaters (SGRs) and anomalous X-ray pulsars (AXPs) are a class of compact objects that show interesting observational properties (see, e.g., Mereghetti 2008): rotational periods in the range P ~ (2 − 12) s, spindown rates Ṗ ~ (10-13–10-10), strong outburst of energies ~(1041 − 1043) erg, and in the case of SGRs, giant flares of even large energies ~(1044–1047) erg.
The most popular model for the description of SGRs and AXPs, the magnetar model, is based
on a neutron star of fiducial parameters
M = 1.4 M⊙, R = 10 km, and
a moment of inertia I = 1045 g cm2. It needs a
neutron star magnetic field larger than the critical field for vacuum polarization
 G in order to explain
the observed X-ray luminosity in terms of the release of magnetic energy (Duncan & Thompson 1992; Thompson & Duncan 1995). There exist in the literature other
models still based on neutron stars but of ordinary fields
B ~ 1012 G; these models involve either the generation of
drift waves in the magnetosphere or the accretion of fallback material via a circumstellar
disk (see Malov 2010; Trümper et al. 2013, respectively, and references therein).
G in order to explain
the observed X-ray luminosity in terms of the release of magnetic energy (Duncan & Thompson 1992; Thompson & Duncan 1995). There exist in the literature other
models still based on neutron stars but of ordinary fields
B ~ 1012 G; these models involve either the generation of
drift waves in the magnetosphere or the accretion of fallback material via a circumstellar
disk (see Malov 2010; Trümper et al. 2013, respectively, and references therein).
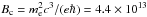
Turning to the experimental point of view, the observation of SGR 0418+5729 with a rotational period of P = 9.08 s, an upper limit of the first time derivative of the rotational period Ṗ < 6.0 × 10⁻¹⁵ (Rea et al. 2010), and an X-ray luminosity of LX = 6.2 × 1031 erg s-1 can be considered as the Rosetta Stone for alternative models of SGRs and AXPs. The inferred upper limit of the surface magnetic field of SGR 0418+5729, B < 7.5 × 10¹² G; which describes it as a neutron star (see Rea et al. 2010, for details), is well below the critical field. This has challenged the power mechanism based on magnetic field decay in the magnetar scenario.
Alternatively, it has been recently pointed out how the pioneering works of Morini et al. (1988) and Paczynski (1990) on the description of 1E 2259+586 as a white dwarf can be indeed extended to all SGRs and AXPs. Such white dwarfs were assumed to have fiducial parameters M = 1.4 M⊙, R = 103 km, I = 1049 g cm2, and magnetic fields B ≳ 107 G inferred from the observed rotation periods and spindown rates (Malheiro et al. 2012).
It is remarkable that white dwarfs with large magnetic fields from 107 G all the way up to 109 G have been indeed observed (see e.g., Külebi et al. 2009, 2010a; Kepler et al. 2010, 2013). Also, most of the observed magnetized white dwarfs are massive; e.g., REJ 0317–853 with M ~ 1.35 M⊙ and B ~ (1.7 − 6.6) × 108 G (Barstow et al. 1995; Külebi et al. 2010b); PG 1658+441 with M ~ 1.31 M⊙ and B ~ 2.3 × 10⁶ G (Liebert et al. 1983; Schmidt et al. 1992); and PG 1031+234 with the highest magnetic field ~109 G (Schmidt et al. 1986; Külebi et al. 2009).
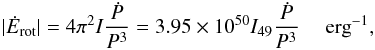
The energetics of SGRs and AXPs, including their steady emission, glitches, and subsequent outburst activities, have been shown to be powered by the rotational energy of the white dwarf (Malheiro et al. 2012). The occurrence of a glitch, the associated sudden shortening of the period, and the corresponding gain of rotational energy can be explained by the release of gravitational energy associated with a sudden contraction and decrease of the moment of inertia of the uniformly rotating white dwarf, which is consistent with the conservation of their angular momentum.
Describing SGR 0418+5729 as a white dwarf, Malheiro et al.
(2012) calculated an upper limit for the magnetic field
B < 7.5 × 10⁸ G and show that the
X-ray luminosity observed from SGR 0418+5729 can be well explained as originating from the
loss of rotational energy of the white dwarf, leading to a theoretical prediction for the
spindown rate 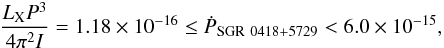 (1)where
the lower limit was established by assuming that the observed X-ray luminosity of SGR
0418+5729 coincides with the rotational energy loss of the white dwarf. As we show below,
these predictions can be improved by considering realistic white dwarf parameters instead of
fiducial values. It is important to mention at this point that, after the submission of this
work, Rea et al. (2013) presented the X-ray timing
analysis of the long-term monitoring of SGR 0418+5729 with RXTE, Swift,
Chandra, and XMM-Newton, which allowed the determination of the spindown
rate of SGR 0418+5729, Ṗ = 4 × 10-15. These results confirm both
our prediction given by Eq. (1) and the more
stringent limits presented in this work in Sect. 4.4
and given by Eq. (10), which are to be
considered to be predictions of the white dwarf model because they were presented in advance
of the observational results given in (Rea et al.
2013).
(1)where
the lower limit was established by assuming that the observed X-ray luminosity of SGR
0418+5729 coincides with the rotational energy loss of the white dwarf. As we show below,
these predictions can be improved by considering realistic white dwarf parameters instead of
fiducial values. It is important to mention at this point that, after the submission of this
work, Rea et al. (2013) presented the X-ray timing
analysis of the long-term monitoring of SGR 0418+5729 with RXTE, Swift,
Chandra, and XMM-Newton, which allowed the determination of the spindown
rate of SGR 0418+5729, Ṗ = 4 × 10-15. These results confirm both
our prediction given by Eq. (1) and the more
stringent limits presented in this work in Sect. 4.4
and given by Eq. (10), which are to be
considered to be predictions of the white dwarf model because they were presented in advance
of the observational results given in (Rea et al.
2013).
The situation has become even more striking considering the X-ray timing monitoring with Swift, RXTE, Suzaku, and XMM-Newton satellites of the recently discovered SGR Swift J1822.3-1606 (Rea et al. 2012). The rotation period P = 8.437 s and the spindown rate Ṗ = 9.1 × 10⁻¹⁴ were obtained. Assuming a neutron star of fiducial parameters, a magnetic field B = 2.8 × 10¹³ G is inferred, which is again in contradiction to a magnetar explanation for this source.
We recently computed (Boshkayev et al. 2013) general relativistic, uniformly rotating white dwarfs within the Hartle’s formalism (Hartle 1967). We used the relativistic Feynman-Metropolis-Teller equation of state (Rotondo et al. 2011), which generalizes the traditionally used equation of state of Salpeter (1961). It was shown there that rotating white dwarfs can be stable up to rotation periods close to 0.3 s (see Boshkayev et al. 2013 and Sect. 3 for details). This range of stable rotation periods for white dwarfs amply covers the observed rotation rates of SGRs and AXPs, P ~ (2–12) s.
The aim of this work is to give a detailed description of the so-called low magnetic field magnetars, SGR 0418+5729 and Swift J1822.3-1606, as massive, fast-rotating, highly magnetized white dwarfs. In addition to these two sources, we also present a similar analysis of the AXP prototype 1E 2259+586, which is the source on which Morini et al. (1988) and Paczynski (1990) proposed the idea of a description of AXPs based on white dwarfs. We thus extend the work of Malheiro et al. (2012) by using precise white dwarf parameters recently obtained by Boshkayev et al. (2013) for general relativistic, uniformly rotating white dwarfs. We present an analysis of the expected optical and near-infrared (near-IR) emission from these sources within the white dwarf model and confront the results with the observational data.
2. Rotation-powered white dwarfs
The loss of rotational energy associated with the spindown of the white dwarf is given by
 (2)where
I49 is the moment of inertia of the white dwarf in units of
1049 g cm2. This rotational energy loss amply justifies the steady
X-ray emission of all SGRs and AXPs (Malheiro et al.
2012).
(2)where
I49 is the moment of inertia of the white dwarf in units of
1049 g cm2. This rotational energy loss amply justifies the steady
X-ray emission of all SGRs and AXPs (Malheiro et al.
2012).
The upper limit on the magnetic field obtained by requesting that the rotational energy
loss due to the dipole field be smaller than the electromagnetic emission of the magnetic
dipole is given by (see, e.g. Ferrari & Ruffini
1969) 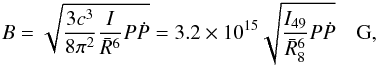 (3)where
 is the mean radius of the white dwarf in units of 108 cm. The mean radius is
given by
is the mean radius of the white dwarf in units of 108 cm. The mean radius is
given by  (see, e.g., Hartle & Thorne 1968) with
Req and Rp the equatorial and
polar radius of the star.
(see, e.g., Hartle & Thorne 1968) with
Req and Rp the equatorial and
polar radius of the star.
It is clear that the specific values of the rotational energy loss and the magnetic field depend on observed parameters, such as P and Ṗ, and on model parameters, such as the mass, moment of inertia, and mean radius of the rotating white dwarf. Equation (3) gives information only on the dipole component of the magnetic field, but there is the possibility that close to the star surface contributions from higher multipoles could also be important. As shown by Qadir et al. (1980), the presence of higher electromagnetic multipoles increases the pulsar braking index to values larger than the traditional value n = 3 of the magneto-dipole radiation.
3. Structure and stability of rotating white dwarfs
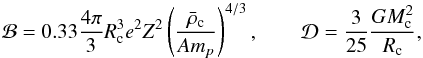
The rotational stability of fast-rotating white dwarfs was implicitly assumed by Malheiro et al. (2012). The crucial question of whether rotating white dwarfs can or cannot attain rotation periods as short as the ones observed in SGRs and AXPs has been recently addressed by Boshkayev et al. (2013). The properties of uniformly rotating white dwarfs were computed within the framework of general relativity through the Hartle’s formalism (Hartle 1967). The equation of state for cold white dwarf matter is based on the relativistic Feynman-Metropolis-Teller treatment (Rotondo et al. 2011), which generalizes the equation of state of Salpeter (1961). The stability of rotating white dwarfs was analyzed taking into account the mass-shedding limit, inverse β-decay, and pycnonuclear instabilities, as well as the secular axisymmetric instability, with the latter determined by the turning point method of Friedman et al. (1988) (see Fig. 1 and Boshkayev et al. 2013, for details).
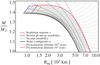 |
Fig. 1 Mass versus equatorial radius of rotating 12C white dwarfs (Boshkayev et al. 2013). The solid black curves correspond to J = constant sequences, where the static case J = 0 is the thickest one. The colored thin dashed curves correspond to P = constant sequences. The Keplerian sequence is the red thick dashed curve, the blue thick dotted-dashed curve is the inverse β instability boundary, and the green thick dotted curve is the axisymmetric instability line. The orange and purple dashed boundaries correspond to the pycnonuclear C+C fusion densities with reaction mean times τpyc = 10 Gyr and 0.1 Myr, respectively. The gray-shaded region is the stability region of rotating white dwarfs. |
The minimum rotation period Pmin of white dwarfs is obtained for a configuration rotating at Keplerian angular velocity at the critical inverse β-decay density; this is the configuration lying at the crossing point between the mass-shedding and inverse β-decay boundaries. The numerical values of the minimum rotation period Pmin ≈ (0.3,0.5,0.7,2.2) s were found for helium, carbon, oxygen, and iron white dwarfs, respectively (Boshkayev et al. 2013). As a byproduct, these values show that indeed all SGRs and AXPs can be described as rotating white dwarfs because their rotation periods are in the range 2 ≲ P ≲ 12 s.
The relatively long minimum period of rotating 56Fe white dwarfs, Pmin ≈ 2.2 s, which lies just at the lower edge of the observed range of rotation periods of SGRs and AXPs, reveals crucial information on the chemical composition of SGRs and AXPs, namely, that they are very likely made of elements lighter than iron, such as carbon or oxygen.
It can be seen from Fig. 1 that every
Ω = 2π/P constant sequence intersects
the stability region of general relativistic, uniformly rotating white dwarfs
(M-Req curves inside the shaded region of
Fig. 1) in two points. These two points determine the
minimum(maximum) mass Mmin,max and
maximum(minimum) equatorial radius  for the stability of a white dwarf rotating at the given angular velocity. Associated with
the boundary values Mmin,max and
,
we can obtain the corresponding bounds for the moment of inertia of the white dwarf,
Imax,min, respectively.
for the stability of a white dwarf rotating at the given angular velocity. Associated with
the boundary values Mmin,max and
,
we can obtain the corresponding bounds for the moment of inertia of the white dwarf,
Imax,min, respectively.
We turn now to a specific analysis of the two sources, SGR 0418+5729 and SGR 1822-1606.
4. SGR 0418+5729
4.1. Bounds on the white dwarf parameters
SGR 0418+5729 has a rotational period of P = 9.08 s, and the upper limit of the spindown rate Ṗ < 6.0 × 10⁻¹⁵ was obtained by Rea et al. (2010). The corresponding rotation angular velocity of the source is Ω = 2π/P = 0.69 rad s-1. We show in Table 1 bounds for the mass, equatorial radius, mean radius, and moment of inertia of SGR 0418+5729, which were obtained by the request of the rotational stability of the rotating white dwarf for selected chemical compositions, as described in Sect. 3. Hereafter we consider only general relativistic, rotating carbon white dwarfs.
Bounds on the properties of SGR 0418+5729.
4.2. Solidification and glitches
It has been shown by Malheiro et al. (2012) that
the massive white dwarfs consistent with SGRs and AXPs possibly behave as solids since the
internal temperature of the white dwarf (~107 K) is very likely lower than the
crystallization temperature (see, e.g., Shapiro &
Teukolsky 1983; Usov 1994) 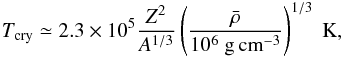 (4)where
(Z,A) and
(4)where
(Z,A) and  denote the chemical composition and mean density, respectively.
This fact introduces the possibility in the white dwarf to observe sudden changes in the period of rotation, namely, glitches. The expected theoretical values of the fractional change of periods of massive white dwarfs have been shown to be consistent with the values observed in many SGRs and AXPs (Malheiro et al. 2012).
From the bounds of M and Req we obtain that
the mean density of SGR 0418+5729 must be in the range
 g cm3. Correspondingly, the crystallization temperature is comprised in the
range 4.8 × 10⁶ K ≲ Tcry ≲ 3.0 × 10⁷ K,
where the lower and upper limits correspond to the configurations of minimum and maximum
mass, respectively.
g cm3. Correspondingly, the crystallization temperature is comprised in the
range 4.8 × 10⁶ K ≲ Tcry ≲ 3.0 × 10⁷ K,
where the lower and upper limits correspond to the configurations of minimum and maximum
mass, respectively.
The crystallization temperature obtained here indicates that SGR 0418+5729 should behave
as a rigid solid body and therefore glitches during the rotational energy loss,
accompanied by radiative events, could happen. Starquakes leading to glitches in the white
dwarf will occur with a recurrence time (see, e.g., Baym
& Pines 1971; Usov 1994; Malheiro et al. 2012)  (5)where
 with
Ėrot the loss of rotational energy given by Eq. (2), Mc,
Rc, and
with
Ėrot the loss of rotational energy given by Eq. (2), Mc,
Rc, and  are the mass, radius, and mean density of the solid core, and
mp is the proton mass.
are the mass, radius, and mean density of the solid core, and
mp is the proton mass.
For the minimum and maximum mass configurations and the upper limit of the spindown rate
Ṗ < 6 × 10-15, we obtain a lower
limit for recurrence time of starquakes: 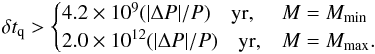 (6)For
typical fractional change of periods
|ΔP|/P = 10-6, which
are observed in SGRs and AXPs, we obtain
δtq > 4 × 10³
yr and
δtq > 2 × 10⁶
yr, for Mmin and Mmax,
respectively. These very long starquake recurrent times are in agreement with the
possibility that SGR 0418+5729 is an old white dwarf whose magnetospheric activity is
settling down, in line with its relatively low spindown rate, magnetic field, and high
efficiency parameter
LX/Ėrot, with
respect to the values of other SGRs and AXPs (see e.g. Fig. 9 in Malheiro et al. 2012).
(6)For
typical fractional change of periods
|ΔP|/P = 10-6, which
are observed in SGRs and AXPs, we obtain
δtq > 4 × 10³
yr and
δtq > 2 × 10⁶
yr, for Mmin and Mmax,
respectively. These very long starquake recurrent times are in agreement with the
possibility that SGR 0418+5729 is an old white dwarf whose magnetospheric activity is
settling down, in line with its relatively low spindown rate, magnetic field, and high
efficiency parameter
LX/Ėrot, with
respect to the values of other SGRs and AXPs (see e.g. Fig. 9 in Malheiro et al. 2012).
4.3. Rotation power and magnetic field
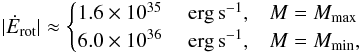
Introducing the values of P and the upper limit Ṗ into
Eq. (2), we obtain an upper limit for the
rotational energy loss 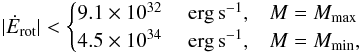 (7)which
for any possible mass is larger than the observed X-ray luminosity of SGR 0418+5729,
LX = 6.2 × 1031 erg s-1, assuming a
distance of 2 kpc (Rea et al. 2010).
(7)which
for any possible mass is larger than the observed X-ray luminosity of SGR 0418+5729,
LX = 6.2 × 1031 erg s-1, assuming a
distance of 2 kpc (Rea et al. 2010).
The corresponding upper limits on the surface magnetic field of SGR 0418+5729, which are
obtained from Eq. (3), are (see also Table
1)  (8)The
above maximum possible value of the surface magnetic field of SGR 0418+5729 obtained for
the maximum possible mass of a white dwarf with rotation period 9.08 s,
B < 3.49 × 10⁸ G is even more
stringent and improves the previous value given by Malheiro et al. (2012),
B < 7.5 × 10⁸ G, based on fiducial
white dwarf parameters.
(8)The
above maximum possible value of the surface magnetic field of SGR 0418+5729 obtained for
the maximum possible mass of a white dwarf with rotation period 9.08 s,
B < 3.49 × 10⁸ G is even more
stringent and improves the previous value given by Malheiro et al. (2012),
B < 7.5 × 10⁸ G, based on fiducial
white dwarf parameters.
The presence of the magnetic field quantizes the electron energy spectrum, and thus
absorption features generated by the scattering of electrons with photons can be observed
at frequencies of the order of 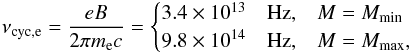 (9)corresponding
to wavelengths 8.9 and 0.3 μm, respectively.
(9)corresponding
to wavelengths 8.9 and 0.3 μm, respectively.
4.4. Prediction of the spindown rate
Assuming that the observed X-ray luminosity is lower than
|Ėrot |, we obtain the lower limit for the spindown rate,
 (10)which
in the case of the white dwarf with the maximum possible mass is more stringent than the
value reported by Malheiro et al. (2012),
Ṗ = 1.18 × 10⁻¹⁶, for a massive white dwarf of fiducial
parameters.
(10)which
in the case of the white dwarf with the maximum possible mass is more stringent than the
value reported by Malheiro et al. (2012),
Ṗ = 1.18 × 10⁻¹⁶, for a massive white dwarf of fiducial
parameters.
4.5. Optical spectrum and luminosity
Durant et al. (2011) observed SGR 0418+5729 with the two wide filters F606W and F110W of the Hubble Space Telescope within the positional error circle derived from Chandra observations of the field of SGR 0418+5729 (Rea et al. 2010). They derive the upper limits of the apparent magnitudes, mF606W > 28.6 and mF110W > 27.4 (Vega system). The approximate distance to the source is d = 2 ± 0.5 kpc (Durant et al. 2011). Assuming an interstellar extinction obtained from the NH column absorption value observed in the X-ray data, AV = 0.7, Durant et al. (2011) obtained the corresponding luminosity upper bounds LF606W < 5 × 1028 erg s-1 and LF110W < 6 × 1028 erg s-1.
We used here a similar method, i.e. computing the interstellar extinction values for the V-band from the NH column absorption value observed in the X-ray data, NH = 1.5 × 1021 cm-2 (Rea et al. 2010), and then using the empirical formula described in Predehl & Schmitt (1995). Then we extrapolated the extinction to the other filters by using the method delineated in Cardelli et al. (1989). Since the F606W and the F110W are well approximated by the V and J-band, we obtained for the extinction values AF606W = 0.83 and AF110W = 0.235 respectively. The corresponding luminosity upper bounds are, consequently, LF606W < 6.82 × 1028 erg s-1 and LF110W < 3.05 × 1028 erg s-1.
An estimate of the effective surface temperature can be obtained by approximating the
spectral luminosity in these bands by the blackbody luminosity 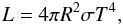 (11)where
σ = 5.67 × 10⁻⁵ erg cm-2 s-1 K
-4 is the Stefan-Boltzmann constant. For a white dwarf of fiducial radius
R = 108 cm, the upper limits for the surface temperature,
T < 9.6 × 10³ K and
T < 9.2 × 10³ K, can be obtained for
the F110W and
F606W filters, replacing the upper
limits for LF110W and
LF606W in Eq. (11). These bounds of the surface temperature
of the white dwarf can be improved by using the explicit dependence on the radius of the
blackbody surface temperature for each filter. The blackbody flux at a given frequency
ν in the source frame is given by
(11)where
σ = 5.67 × 10⁻⁵ erg cm-2 s-1 K
-4 is the Stefan-Boltzmann constant. For a white dwarf of fiducial radius
R = 108 cm, the upper limits for the surface temperature,
T < 9.6 × 10³ K and
T < 9.2 × 10³ K, can be obtained for
the F110W and
F606W filters, replacing the upper
limits for LF110W and
LF606W in Eq. (11). These bounds of the surface temperature
of the white dwarf can be improved by using the explicit dependence on the radius of the
blackbody surface temperature for each filter. The blackbody flux at a given frequency
ν in the source frame is given by ![Mathematical equation: \begin{eqnarray} \label{eq:BB} \nu f_\nu =\pi\frac{2 h}{c^2}\frac{\nu^4}{\exp[h \nu/(k T)]-1}, \end{eqnarray}](/articles/aa/full_html/2013/07/aa20819-12/aa20819-12-eq141.png) (12)where
h, k, and ν are the Planck constant,
the Boltzmann constant, and the spectral frequency, respectively. From this expression we
can obtain the temperature as a function of the frequency, the observed flux, the distance
d, and radius R of the blackbody source
(12)where
h, k, and ν are the Planck constant,
the Boltzmann constant, and the spectral frequency, respectively. From this expression we
can obtain the temperature as a function of the frequency, the observed flux, the distance
d, and radius R of the blackbody source 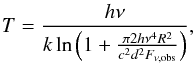 (13)where
we used the relation between the flux in the observed and source frames,
Fν,obs = (R/d)2 νfν.
(13)where
we used the relation between the flux in the observed and source frames,
Fν,obs = (R/d)2 νfν.
The observed fluxes, in units of erg, cm-2, s-1, corrected for
the extinction are given by  (14)and
 (15)where
νF606W = 5.1 × 10¹⁴
Hz and
νF110W = 2.6 × 10¹⁴
Hz are the pivot frequencies of the
F606W and
F110W filters, respectively.
(15)where
νF606W = 5.1 × 10¹⁴
Hz and
νF110W = 2.6 × 10¹⁴
Hz are the pivot frequencies of the
F606W and
F110W filters, respectively.
Introducing the upper limits of the apparent magnitudes of Durant et al. (2011) with the extinction values computed in this work, Eq.
(13) gives the upper bounds on the
temperature ![Mathematical equation: \begin{eqnarray} \label{eq:TRconstraint} T< \begin{cases} 1.3\times 10^4\,\left[\ln(1 + 0.44 R^2_8)\right]^{-1}\quad {\rm K}, & {F110W}\\ 2.4\times 10^4\,\left[\ln(1 + 6.35 R^2_8)\right]^{-1}\quad {\rm K}, & {F606W} \end{cases}, \end{eqnarray}](/articles/aa/full_html/2013/07/aa20819-12/aa20819-12-eq155.png) (16)where
(16)where
 is the radius
of the white dwarf in units of 108 cm and, following Durant et al. (2011), we approximated the band integrated flux as
νcFν, with
νc the pivot wavelength of the corresponding band filter.
is the radius
of the white dwarf in units of 108 cm and, following Durant et al. (2011), we approximated the band integrated flux as
νcFν, with
νc the pivot wavelength of the corresponding band filter.
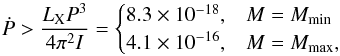
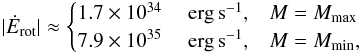
In Fig. 2, we show the constraints on the T-R relation obtained from Eq. (16). We used the range of radii defined by the minimum and maximum radius of SGR 0418+5729, which was inferred from the white dwarf stability analysis and summarized in Table 1.
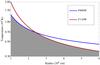 |
Fig. 2 Temperature-radius constraint given by Eq. (16). The gray region corresponds to the possible values for the temperature and the radius of the white dwarf. The range of radii corresponds to the one defined by the minimum and maximum mean radius of SGR 0418+5729, which was inferred from the white dwarf stability analysis and summarized in Table 1. |
Malheiro et al. (2012) obtained for a white dwarf
of fiducial parameters the upper limits for the white dwarf surface temperature,
T < 3.14 × 10⁴. We now improve these
bounds on the surface temperature using realistic white dwarf parameters. From the minimum
and maximum values we obtained for the mean radius of SGR 0418+5729 (see Table 1) we obtain for the
F110W filter
 (17)and
for the F606W filter
(17)and
for the F606W filter
 (18)It
is clear that these constraints are in agreement with a model based on a massive
fast-rotating highly magnetic white dwarf for SGR 0418+5729. It is appropriate to recall
in this respect some of the observed temperatures of massive isolated white dwarfs,
1.14 × 10⁴ K ≤ T ≤ 5.52 × 10⁴ K, as shown in
Table 1 in Ferrario et al. (2005). It is also worth
recalling the optical observations of 4U 0142+61 of Hulleman et al. (2000), where the photometric results of the field of 4U 0142+61
at the 60-inch telescope on Palomar Mountain were found to be in agreement with a
1.3 M⊙ white dwarf with a surface temperature
~4 × 10⁵ K.
(18)It
is clear that these constraints are in agreement with a model based on a massive
fast-rotating highly magnetic white dwarf for SGR 0418+5729. It is appropriate to recall
in this respect some of the observed temperatures of massive isolated white dwarfs,
1.14 × 10⁴ K ≤ T ≤ 5.52 × 10⁴ K, as shown in
Table 1 in Ferrario et al. (2005). It is also worth
recalling the optical observations of 4U 0142+61 of Hulleman et al. (2000), where the photometric results of the field of 4U 0142+61
at the 60-inch telescope on Palomar Mountain were found to be in agreement with a
1.3 M⊙ white dwarf with a surface temperature
~4 × 10⁵ K.
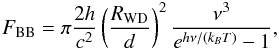
We show in Fig. 3 the expected optical magnitudes of a white dwarf with surface temperature T = 104 K and radius R = 1.5 × 108 cm, located at a distance of 2 kpc. This radius corresponds to the upper limit that is given by the gray region shown in Fig. 2 for this specific value of the temperature.
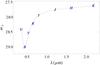 |
Fig. 3 Expected optical magnitudes of SGR 0418+5729 obtained assuming a simple blackbody for the spectral emission from a white dwarf with surface temperature T = 104 K and a radius of 1.5 × 108 cm, according to the constraints shown in Fig. 2. |
5. Swift J1822.3-1606
5.1. Bounds of the white dwarf parameters
Swift J1822.3-1606 (or SGR 1822-1606) was discovered in July 2011 by the Swift Burst Alert Telescope (BAT). Recent X-ray timing monitoring with Swift, RXTE, Suzaku, and XMM-Newton satellites found that SGR 1822-1606 rotates with a period of P = 8.44 s and slows down at a rate Ṗ = 9.1 × 10⁻¹⁴ (see Rea et al. 2012, for details). The corresponding rotation angular velocity of the source is Ω = 2π/P = 0.74 rad s-1. Bounds for the mass, equatorial radius, and moment of inertia of SGR 0418+5729 obtained by the request of the rotational stability of the rotating white dwarf, as described in Sect. 4, are shown in Table 2.
Bounds on the properties of Swift J1822.3-1606.
5.2. Solidification and glitches
The mean density of SGR 1822-1606 is in the range  g cm3. The crystallization temperature for such a range following Eq. (4) is then in the range 5.0 × 10⁶ K
≲ Tcry ≲ 3.0 × 10⁷ K, which indicates that SGR
1822-1606 will likely behave as a rigid solid body.
g cm3. The crystallization temperature for such a range following Eq. (4) is then in the range 5.0 × 10⁶ K
≲ Tcry ≲ 3.0 × 10⁷ K, which indicates that SGR
1822-1606 will likely behave as a rigid solid body.
For the minimum and maximum mass configurations and the spindown rate
Ṗ = 9.1 × 10⁻¹⁴, we obtain a lower limit for recurrence time
of starquakes, 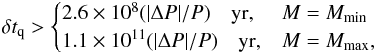 (19)which
for a typical fractional change of period
|ΔP|/P ~ 10-6 gives
δtq > 3 × 10²
yr and
δtq > 105
yr for Mmin and Mmax,
respectively. The long recurrence time for starquakes obtained in this case confirms the
similarities between SGR 1822-1606 and SGR 0418+5729 as old objects with a settling down
magnetospheric activity.
(19)which
for a typical fractional change of period
|ΔP|/P ~ 10-6 gives
δtq > 3 × 10²
yr and
δtq > 105
yr for Mmin and Mmax,
respectively. The long recurrence time for starquakes obtained in this case confirms the
similarities between SGR 1822-1606 and SGR 0418+5729 as old objects with a settling down
magnetospheric activity.
5.3. Rotation power and magnetic field
Using the observed values of P and Ṗ, we obtain from
Eq. (2) a rotational energy loss
 (20)which
amply justifies the observed X-ray luminosity of SGR 1822-1606,
LX = 4 × 1032 erg s-1, which was
obtained assuming a distance of 5 kpc (Rea et al.
2012).
(20)which
amply justifies the observed X-ray luminosity of SGR 1822-1606,
LX = 4 × 1032 erg s-1, which was
obtained assuming a distance of 5 kpc (Rea et al.
2012).
The surface magnetic field of SGR 1822.3–1606, as given by Eq. (3), is then between the values (see Table 2) 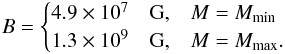 (21)Corresponding
to the above magnetic fields, the electron cyclotron frequencies are
(21)Corresponding
to the above magnetic fields, the electron cyclotron frequencies are 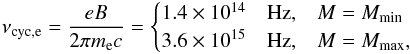 (22)which
correspond to wavelengths 2.2 and 0.08 μm, respectively.
(22)which
correspond to wavelengths 2.2 and 0.08 μm, respectively.
5.4. Optical spectrum and luminosity
Rea et al. (2012) observed the field of SGR 1822-1606 with the Gran Telescopio Canarias (GranTeCan) within the Swift-XRT position (Pagani et al. 2011). Three sources (S1, S2, and S3) were detected with the Sloan z filter with corresponding z-band magnitudes mz,S1 = 18.13 ± 0.16, mz,S2 = 20.05 ± 0.04, and mz,S3 = 19.94 ± 0.04 (Rea et al. 2012). No additional objects were found to be consistent with the Swift-XRT position up to a magnitude mz = 22.2 ± 0.2 (3σ).
In addition, data from the UK Infrared Deep Sky Survey (UKIDSS) for the field of SGR 1822-1606 were found to be available, giving the magnitudes of the three aforementioned sources in the J, H, and K bands; mJ,i = (13.92,16.62,16.43), mH,i = (12.37,15.75,15.40), and mK,i = (11.62,15.20,14.88), where the index i indicates the values for the sources S1, S2, and S3. In addition to S1, S2, and S3, no sources were detected within the consistent position up to the limiting magnitudes mJ = 19.3, mH = 18.3, and mK = 17.3 (5σ).
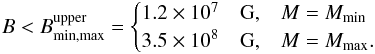
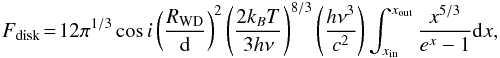
We repeat the same analysis for SGR 0418+5729 for the case of SGR 1822-1606. We consider only the upper limits since the three sources reported in Rea et al. (2012), S1, S2, and S3, are too luminous to be a white dwarf at the distance considered for the source, d ≈ 5 kpc. From the column density value, NH = 7 × 1021 cm-2, we obtain an extinction in the V-band of AV = 3.89. From the Cardelli et al. (1989) relation, we obtain the extinction values for the four bands considered: Az = 1.86, AJ = 1.10, AH = 0.74, and AK = 0.44. The extinction-corrected upper limits do not put very strong constraints on the temperature and the radius of the white dwarf due to the very large distance assumed for SGR 1822-1606. We show in Fig 4 the expected extinction-corrected magnitudes for a white dwarf with a temperature T = 104 K and a radius R = 1.5 × 108 cm at a distance of 5 kpc. We obtain a very deep value for the K-band of ≈30. We conclude that, if SGR 1822-1606 is at the distance of 5 kpc assumed by Rea et al. (2012), it will be hard to detect the white dwarf. On the contrary, a possible detection would lead to a more precise determination of the distance.
 |
Fig. 4 Expected optical magnitudes of SGR 1822-1606, assuming a blackbody spectral emission from a white dwarf with surface temperature T = 104 K and a radius of 1.5 × 108 cm. |
6. 1E 2259+586
6.1. Bounds of the white dwarf parameters
In addition to being considered as the AXP prototype, 1E 2259+586 is the source on which Morini et al. (1988) and Paczynski (1990) based their pioneering idea of describing AXPs as massive, fast-rotating, and highly magnetized white dwarfs. This source is pulsating in X-rays with a period of P = 6.98 s (Fahlman & Gregory 1981), has a spindown rate of Ṗ = 4.8 × 10⁻¹³ (Davies et al. 1990), and emits X-rays with a luminosity of LX = 1.8 × 1034 erg s-1 (Gregory & Fahlman 1980; Hughes et al. 1981; Morini et al. 1988). The corresponding rotation angular velocity of the source is Ω = 2π/P = 0.90 rad s-1. The obtained bounds for the mass, equatorial radius, and moment of inertia of 1E 2259+586 are shown in Table 3.
Bounds on the properties of 1E 2259+586.
6.2. Solidification and glitches
The mean density of SGR 1822-1606 is in the range  g cm-3. The crystallization temperature for such a range following Eq. (4) is then in the range 5.7 × 10⁶ K
≲ Tcry ≲ 3.0 × 10⁷ K, which indicates that SGR
1822-1606 will likely behave as a rigid solid body.
g cm-3. The crystallization temperature for such a range following Eq. (4) is then in the range 5.7 × 10⁶ K
≲ Tcry ≲ 3.0 × 10⁷ K, which indicates that SGR
1822-1606 will likely behave as a rigid solid body.
For the minimum and maximum mass configurations and the spindown rate
Ṗ = 4.8 × 10⁻¹³, we obtain a lower limit for recurrence time
of starquakes of  (23)which
for a typical fractional change of period
|ΔP|/P ~ 10-6 gives
δtq > 45 yr and
δtq > 1.2 × 10⁴
yr, for Mmin and Mmax,
respectively. This recurrence time for starquakes is much shorter than the ones of SGR
0418+5729 and SGR 1822-1606, indicating that 1E 2259+586 is a very active source in which
glitches and outburst activity, such as those observed in 2002 (Kaspi et al. 2003; Woods et al.
2004), can occur with relatively high frequency. It is interesting to note that
glitches of minor intensity
|ΔP|/P ≲ 10-7 can be
even more frequent, with recurrence times of ≲4 yr.
(23)which
for a typical fractional change of period
|ΔP|/P ~ 10-6 gives
δtq > 45 yr and
δtq > 1.2 × 10⁴
yr, for Mmin and Mmax,
respectively. This recurrence time for starquakes is much shorter than the ones of SGR
0418+5729 and SGR 1822-1606, indicating that 1E 2259+586 is a very active source in which
glitches and outburst activity, such as those observed in 2002 (Kaspi et al. 2003; Woods et al.
2004), can occur with relatively high frequency. It is interesting to note that
glitches of minor intensity
|ΔP|/P ≲ 10-7 can be
even more frequent, with recurrence times of ≲4 yr.
6.3. Rotation power and magnetic field
Using the observed values of P and Ṗ, we obtain from
Eq. (2) a rotational energy loss
 (24)which
is much larger than the observed X-ray luminosity,
LX = 1.8 × 1034 erg s-1, assuming a
distance of 3.2 ± 0.2 kpc (Kothes & Foster
2012).
(24)which
is much larger than the observed X-ray luminosity,
LX = 1.8 × 1034 erg s-1, assuming a
distance of 3.2 ± 0.2 kpc (Kothes & Foster
2012).
The surface magnetic field of 1E 2259+586 inferred from Eq. (3) is (see Table 3) 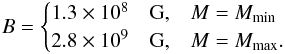 (25)Corresponding
to the above magnetic fields, the electron cyclotron frequencies are
(25)Corresponding
to the above magnetic fields, the electron cyclotron frequencies are 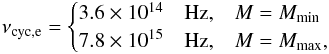 (26)which
correspond to wavelengths 0.8 and 0.04 μm, respectively.
(26)which
correspond to wavelengths 0.8 and 0.04 μm, respectively.
6.4. Optical spectrum and luminosity
Using data from the Keck telescope, Hulleman et al. (2001) established a faint near-IR counterpart of 1E 2259+586 with a magnitude Ks = 21.7 ± 0.2, which is consistent with the position given by Chandra. In addition, upper limits were placed in the optical bands R = 26.4, I = 25.6, and J = 23.8. From the column density obtained by Patel et al. (2001), NH = 9.3 ± 0.3 × 1021 cm-2, and using again the empirical formula described by Predehl & Schmitt (1995), we obtain the absorption AV = NH/(1.79 × 1021 cm-2), which Hulleman et al. (2001) used to obtain the extinction in the other bands AR = 4.3, AI = 3.1, AJ = 1.4, AK = 0.6.
It is known that the emission in the K band, the excess in the near-IR,
is typically produced by the presence of a disk; see for instance, Hulleman et al. (2000) for the case of 4U 0142+61 and Hulleman et al. (2001) for the present source
1E2259+586, although both are in the context of a fallback disk around a neutron star. We
fit the spectrum of 1E 2259+586 as the sum of a blackbody component
 (27)where
RWD and T are the radius and effective
temperature of the white dwarf, and a passive, flat, opaque dust disk (see e.g., Jura 2003; Lorén-Aguilar et al. 2009)
(27)where
RWD and T are the radius and effective
temperature of the white dwarf, and a passive, flat, opaque dust disk (see e.g., Jura 2003; Lorén-Aguilar et al. 2009)
 (28)where
i is the inclination angle of the disk, which we assume as zero
degrees,
xin = hν/(kBTin),
xin = hν/(kBTout),
with Tin and Tout the temperatures
of the disk at the inner and outer radii, respectively. These temperatures are related to
the radii Rin and Rout of the disk
through
Tin,out = (2/3π)1/4(RWD/Rin,out)3/4T.
(28)where
i is the inclination angle of the disk, which we assume as zero
degrees,
xin = hν/(kBTin),
xin = hν/(kBTout),
with Tin and Tout the temperatures
of the disk at the inner and outer radii, respectively. These temperatures are related to
the radii Rin and Rout of the disk
through
Tin,out = (2/3π)1/4(RWD/Rin,out)3/4T.
The total flux is then given by FBB + disk = FBB + Fdisk. Since we have only one point from the observational data, the flux in the Ks band, it is difficult to place constraints on the spectrum parameters. However, we can use the fact that the emission has to respect the upper limits in the R, I, and J bands. We have fixed the radius of the white dwarf as RWD = 3 × 108 cm, a value in the interval of stability of Table 3, and for the outer radius of the passive disk we give a typical value Rout = R⊙. We found that good fitting values of the other parameters are T = 7.0 × 10⁴ K and Tin = 2.0 × 10³ K. In Fig. 5 we show the observed spectrum of 1E 2259+586 in the IR, optical, and UV bands and the composite blackbody + disk model spectrum. The knowledge of more data besides the Ks band will lead to a definite determination of the parameter of the model and to confirmation of the white dwarf nature of 1E 2259+586.
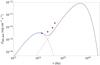 |
Fig. 5 Observed and fitted spectrum of 1E 2259+586. The filled circle is the observed flux in the Ks band, and the triangles are the upper limits in the R, I, and J bands. The parameters of the blackbody+disk spectrum are RWD = 3.0 × 108 cm, T = 7.0 × 10⁴ K, Tin = 2.0 × 10³ K, and Rout = R⊙. The blue-dashed curve is the contribution of the disk and the red-dashed curve is the contribution from a pure blackbody. The total spectrum is represented by the solid black curve. |
It is worth recalling that the location of 1E 2259+586 appears to be associated with the supernova remnant G109.1–1.0 (CTB 109) whose age is estimated to be t − t0 = (12 − 17) kyr (Gregory & Fahlman 1980; Hughes et al. 1981). Paczynski (1990) proposed a merger of a binary of ~(0.7 − 1) M⊙ white dwarfs, which leads both to the formation of a fast-rotating white dwarf and to the supernova remnant. Recent simulations of (0.8 − 0.9 M⊙) white dwarf mergers (see, e.g., Pakmor et al. 2010) point however to supernova events below the observed explosion energy ~7.4 × 1050 erg of G109.1–1.0 (see, e.g., Sasaki et al. 2004). These events are not very efficient energetically. Additionally, Malheiro et al. (2012) advanced the interesting possibility that this system could be originated from a tight binary system composed of a white dwarf and a late-evolved companion star, thus approaching the process of gravitational collapse. The collapse of the companion star, either to a neutron star or to a black hole, leads, to mass loss which can unbind the original binary system. If the loss of mass in the supernova explosion is Mloss < M/2 with M the total mass of the binary (see, e.g., Ruffini 1973), the system holds bound and the object will therefore lie close to the center of the supernova remnant. Both explanations are interesting and deserve further investigation. These two scenarios may well explain the presence of a disk of material around the white dwarf, either as material expelled from the white dwarf binary merger (see, e.g., Lorén-Aguilar et al. 2009) in the scenario of Paczynski (1990) or as material coming from the supernova explosion, which is captured by the white dwarf in the scenario of Malheiro et al. (2012). As we have seen, the presence of such a disk explains the emission in the near-IR observed in sources such as 4U 0142+61 (see, e.g., Hulleman et al. 2000) and in the present case of 1E 2259+586.
7. Concluding remarks
We have described SGR 0418+5729, Swift J1822.3-1606, and 1E 2259+586 as massive, fast-rotating, highly magnetized white dwarfs. The reasons for the choice of these three sources are twofold: 1) the observations of SGR 0418+5729 (Rea et al. 2010), P = 9.08 and Ṗ < 6.0 × 10⁻¹⁵, and more recently the ones of Swift J1822.3-1606 (Rea et al. 2012), P = 8.44 s and Ṗ = 9.1 × 10⁻¹⁴, challenge the description of these sources as ultramagnetized neutron stars, as required by the magnetar model; 2) 1E 2259+586 is considered the AXP prototype with very good observational data, including the best example of the glitch-outburst connection (see, e.g., Woods et al. 2004). In addition, it represents a historical object, being the one analyzed by Morini et al. (1988) and Paczynski (1990), where the canonical description based on white dwarfs was proposed.
We have shown that SGR 0418+5729 and Swift J1822.3-1606 are in full agreement with massive, fast-rotating, highly magnetized white dwarfs. We have improved the white dwarf parameters given by Malheiro et al. (2012) for these sources and also for 1E 2259+586. From an analysis of the rotational stability of Boshkayev et al. (2013), we have given bounds for the mass, radius, moment of inertia, and magnetic field of these sources; see Tables 1–3 for details.
We have improved the theoretical prediction of the lower limit for the spindown rate of SGR 0418+5729, for which only the upper limit, Ṗ < 6.0 × 10⁻¹⁵, is currently known (Rea et al. 2010). Based on a white dwarf of fiducial parameters, Malheiro et al. (2012) predicted for SGR 0418+5729 the lower limit Ṗ > 1.18 × 10⁻¹⁶. Our present analysis, which is based on realistic, general relativistic, rotating white dwarfs allows us to improve this prediction; see Eq. (10) in Sect. 4.4 for the new numerical values. In the case of a white dwarf close to the critical mass, this new lower limit gives a very stringent constraint on the spindown rate of SGR 0418+5729, Ṗ = 4 × 10-16 < Ṗ < 6 × 10-15, which we submit for observational verification. Indeed, after the submission of this work, Rea et al. (2013) reported the confirmation of the spindown rate of SGR 0418+5729, Ṗ = 4 × 10-15, at 3.5 sigma confidence level. This measurement fully confirms the results of Malheiro et al. (2012), see Eq. (1), as well as the more stringent constraints presented in this work, see Eq. (10). Since these constraints are presented in advance to the observations, they have to be considered as predictions. This fact clearly represents an observational support for the white dwarf model of SGRs/AXPs.
Along these lines it is worth mentioning the recent discussions on the high uncertainties and different results claimed by different authors on the value of the first period time derivative of Swift J1822.3-1606 (see Tong & Xu 2012 and references therein for details). Here we have used the value reported by Rea et al. (2012). However, it would also be interesting in this case to put a theoretical lower limit with the white dwarf mode. Using LX = 4 × 1032 erg s-1 at a distance of 5 kpc (Rea et al. 2012), we obtain a lower limit Ṗ ≥ LXP3/(4π2I) ≈ 2.13 × 10⁻¹⁵ for a 12C white dwarf close to its maximum mass; see Table 3. Indeed, this limit bounds from below all the observationally claimed spindown rates for this source known up to now.
We gave in Eqs. (9), (22), and (26) an additional prediction of the frequencies at which absorption features could be present in the spectra of SGR 0418+5729, Swift J1822.3-1606, and 1E2259+586, respectively, as a result of the scattering of photons with electrons whose energy spectrum is quantized due to the magnetic field. The range we obtained for such frequencies falls between the infrared and UV bands. It is important to remark that magnetic fields in white dwarfs ranging from 107 G up to 109 G are routinely observed; see, e.g., Külebi et al. (2009), Külebi et al. (2010a), Kepler et al. (2010), and very recently Kepler et al. (2013), where from the Data Release 7 of the Sloan Digital Sky Survey, white dwarfs with magnetic fields in the range from around 106 G to 7.3 × 10⁸ G have been found from the analysis of the Zeeman splitting of the Balmer absorption lines. Deep photometric and spectrometric observations in the range of cyclotron frequencies predicted in this work are therefore highly recommended to detect possible absorptions and line-splitting features in the spectra of SGRs and AXPs.
We have presented the optical properties of SGR 0418+ 5729, Swift J1822.3-1606, and 1E 2259+586, as expected from a model based on white dwarfs. We inferred the surface temperature and predicted the emission fluxes in the UV, optical, and IR bands. We have shown that indeed the available observational data are consistent with a white dwarf model for these objects. In the particular case of 1E 2259+586, the observed excess in the near-IR is explained by the presence of a disk of dust around the white dwarf. Such a disk might be the result of material expelled during the merger of a white dwarf binary progenitor (Paczynski 1990; Rueda et al. 2013) or as the result of material from the supernova explosion of an evolved star companion of the white dwarf in the binary scenario proposed by Malheiro et al. (2012) for the SGR/AXP-supernova connection.
It is important to discuss briefly the persistent X-ray emission of SGRs/AXPs. The time integrated X-ray spectrum is often well described by a composite blackbody + power-law model with temperatures of the order of kBTBB ~ 0.1 keV (see, e.g., Göhler et al. 2005). Such a blackbody component corresponds to temperatures TBB ~ 106 K, which are higher than the surface temperature of a white dwarf (i.e., such as the ones predicted in this work). This clearly points to an X-ray emission of magnetospheric origin, and so this blackbody temperature of the X-ray spectrum is not to be associated with the white dwarf effective temperature (see, e.g., Malheiro et al. 2012). A possible mechanism for the X-ray quiescent emission from a magnetized white dwarf was underlined by Usov (1993): the reheating of the magnetosphere owing to the bombardment of the backward moving positrons, which were created in the pair cascades formed in the interaction of the high-energy photons with the ultra-relativistic electrons. As shown by Usov (1993) in the specific case of 1E 2259+586, such a reheating of the polar caps is able to produce a stable X-ray luminosity LX ~ 1035 erg s-1, in agreement with observations.
A well-known observational problem of SGRs and AXPs is the uncertainty in the estimation of the distances of the sources (see, e.g., Kothes & Foster (2012) for a critical discussion on the distance of 1E2259+586). These uncertainties strongly affect the estimates of the interstellar reddening AV, which are crucial for the precise calculation of the source properties and therefore for a clear identification of the nature of the compact object. Deeper observations of Hubble and VLT are thus strongly recommended to establish the precise values of the luminosity in the optical and in the near-IR bands, which will verify the white dwarf nature of SGRs and AXPs.
We encourage future observational campaigns from space and ground to verify all the predictions presented in this work.
Acknowledgments
We thank the referee, Alexander Potekhin, for the comments and suggestions, which helped us to improve the presentation of our results.
References
- Barstow, M. A., Jordan, S., O’Donoghue, D., et al. 1995, MNRAS, 277, 971 [NASA ADS] [CrossRef] [Google Scholar]
- Baym, G., & Pines, D. 1971, Ann. Phys., 66, 816 [NASA ADS] [CrossRef] [Google Scholar]
- Boshkayev, K., Rueda, J. A., Ruffini, R., & Siutsou, I. 2013, ApJ, 762, 117 [NASA ADS] [CrossRef] [Google Scholar]
- Cardelli, J. A., Clayton, G. C., & Mathis, J. S. 1989, ApJ, 345, 245 [NASA ADS] [CrossRef] [Google Scholar]
- Davies, S. R., Coe, M. J., & Wood, K. S. 1990, MNRAS, 245, 268 [NASA ADS] [Google Scholar]
- Duncan, R. C., & Thompson, C. 1992, ApJ, 392, L9 [NASA ADS] [CrossRef] [Google Scholar]
- Durant, M., Kargaltsev, O., & Pavlov, G. G. 2011, ApJ, 742, 77 [NASA ADS] [CrossRef] [Google Scholar]
- Fahlman, G. G., & Gregory, P. C. 1981, Nature, 293, 202 [NASA ADS] [CrossRef] [Google Scholar]
- Ferrari, A., & Ruffini, R. 1969, ApJ, 158, L71 [NASA ADS] [CrossRef] [Google Scholar]
- Ferrario, L., Wickramasinghe, D., Liebert, J., & Williams, K. A. 2005, MNRAS, 361, 1131 [NASA ADS] [CrossRef] [Google Scholar]
- Friedman, J. L., Ipser, J. R., & Sorkin, R. D. 1988, ApJ, 325, 722 [NASA ADS] [CrossRef] [Google Scholar]
- Göhler, E., Wilms, J., & Staubert, R. 2005, A&A, 433, 1079 [NASA ADS] [CrossRef] [EDP Sciences] [Google Scholar]
- Gregory, P. C., & Fahlman, G. G. 1980, Nature, 287, 805 [NASA ADS] [CrossRef] [Google Scholar]
- Hartle, J. B. 1967, ApJ, 150, 1005 [Google Scholar]
- Hartle, J. B., & Thorne, K. S. 1968, ApJ, 153, 807 [NASA ADS] [CrossRef] [Google Scholar]
- Hughes, V. A., Harten, R. H., & van den Bergh, S. 1981, ApJ, 246, L127 [NASA ADS] [CrossRef] [Google Scholar]
- Hulleman, F., van Kerkwijk, M. H., & Kulkarni, S. R. 2000, Nature, 408, 689 [NASA ADS] [CrossRef] [Google Scholar]
- Hulleman, F., Tennant, A. F., van Kerkwijk, M. H., et al. 2001, ApJ, 563, L49 [NASA ADS] [CrossRef] [Google Scholar]
- Jura, M. 2003, ApJ, 584, L91 [NASA ADS] [CrossRef] [Google Scholar]
- Kaspi, V. M., Gavriil, F. P., Woods, P. M., et al. 2003, ApJ, 588, L93 [NASA ADS] [CrossRef] [Google Scholar]
- Kepler, S. O., Kleinman, S. J., Pelisoli, I., et al. 2010, in AIP Conf. Ser. 1273, eds. K. Werner, & T. Rauch, 19 [Google Scholar]
- Kepler, S. O., Pelisoli, I., Jordan, S., et al. 2013, MNRAS, 429, 2934 [NASA ADS] [CrossRef] [Google Scholar]
- Kothes, R., & Foster, T. 2012, ApJ, 746, L4 [NASA ADS] [CrossRef] [Google Scholar]
- Külebi, B., Jordan, S., Euchner, F., Gänsicke, B. T., & Hirsch, H. 2009, A&A, 506, 1341 [NASA ADS] [CrossRef] [EDP Sciences] [Google Scholar]
- Külebi, B., Jordan, S., Euchner, F., Gaensicke, B. T., & Hirsch, H. 2010a, VizieR Online Data Catalog: JIA+A/1506/1341 [Google Scholar]
- Külebi, B., Jordan, S., Nelan, E., Bastian, U., & Altmann, M. 2010b, A&A, 524, A36 [NASA ADS] [CrossRef] [EDP Sciences] [Google Scholar]
- Liebert, J., Schmidt, G. D., Green, R. F., Stockman, H. S., & McGraw, J. T. 1983, ApJ, 264, 262 [NASA ADS] [CrossRef] [Google Scholar]
- Lorén-Aguilar, P., Isern, J., & García-Berro, E. 2009, A&A, 500, 1193 [NASA ADS] [CrossRef] [EDP Sciences] [Google Scholar]
- Malheiro, M., Rueda, J. A., & Ruffini, R. 2012, PASJ, 64, 56 [NASA ADS] [Google Scholar]
- Malov, I. F. 2010, Astron. Rep., 54, 925 [NASA ADS] [CrossRef] [Google Scholar]
- Mereghetti, S. 2008, A&AR, 15, 225 [NASA ADS] [CrossRef] [Google Scholar]
- Morini, M., Robba, N. R., Smith, A., & van der Klis, M. 1988, ApJ, 333, 777 [NASA ADS] [CrossRef] [Google Scholar]
- Paczynski, B. 1990, ApJ, 365, L9 [NASA ADS] [CrossRef] [Google Scholar]
- Pagani, C., Beardmore, A. P., & Kennea, J. A. 2011, ATel., 3493, 1 [NASA ADS] [Google Scholar]
- Pakmor, R., Kromer, M., Röpke, F. K., et al. 2010, Nature, 463, 61 [NASA ADS] [CrossRef] [PubMed] [Google Scholar]
- Patel, S. K., Kouveliotou, C., Woods, P. M., et al. 2001, ApJ, 563, L45 [NASA ADS] [CrossRef] [Google Scholar]
- Predehl, P., & Schmitt, J. H. M. M. 1995, A&A, 293, 889 [NASA ADS] [Google Scholar]
- Qadir, A., Ruffini, R., & Violini, G. 1980, Nuovo Cimento Lettere, 27, 381 [Google Scholar]
- Rea, N., Esposito, P., Turolla, R., et al. 2010, Science, 330, 944 [NASA ADS] [CrossRef] [PubMed] [Google Scholar]
- Rea, N., Israel, G. L., Esposito, P., et al. 2012, ApJ, 754, 27 [NASA ADS] [CrossRef] [Google Scholar]
- Rea, N., Israel, G. L., Pons, J. A., et al. 2013, ApJ, 770, 65 [NASA ADS] [CrossRef] [Google Scholar]
- Rotondo, M., Rueda, J. A., Ruffini, R., & Xue, S.-S. 2011, Phys. Rev. C, 83, 045805 [NASA ADS] [CrossRef] [Google Scholar]
- Rueda, J. A., Aznar-Siguán, G., Boshkayev, K., et al. 2013, ApJ, submitted [Google Scholar]
- Ruffini, R. 1973, in Black Holes (Les Astres Occlus), ed. A. Giannaras, 451 [Google Scholar]
- Salpeter, E. E. 1961, ApJ, 134, 669 [NASA ADS] [CrossRef] [Google Scholar]
- Sasaki, M., Plucinsky, P. P., Gaetz, T. J., et al. 2004, ApJ, 617, 322 [NASA ADS] [CrossRef] [Google Scholar]
- Schmidt, G. D., West, S. C., Liebert, J., Green, R. F., & Stockman, H. S. 1986, ApJ, 309, 218 [NASA ADS] [CrossRef] [Google Scholar]
- Schmidt, G. D., Bergeron, P., Liebert, J., & Saffer, R. A. 1992, ApJ, 394, 603 [NASA ADS] [CrossRef] [Google Scholar]
- Shapiro, S. L., & Teukolsky, S. A. 1983, Black holes, white dwarfs, and neutron stars: The physics of compact objects, eds. S. L. Shapiro, & S. A. Teukolsky [Google Scholar]
- Thompson, C., & Duncan, R. C. 1995, MNRAS, 275, 255 [NASA ADS] [CrossRef] [Google Scholar]
- Tong, H., & Xu, R. X. 2012 [arXiv:1212.4314] [Google Scholar]
- Trümper, J. E., Dennerl, K., Kylafis, N. D., Ertan, Ü., & Zezas, A. 2013, ApJ, 764, 49 [NASA ADS] [CrossRef] [Google Scholar]
- Usov, V. V. 1993, ApJ, 410, 761 [NASA ADS] [CrossRef] [Google Scholar]
- Usov, V. V. 1994, ApJ, 427, 984 [NASA ADS] [CrossRef] [Google Scholar]
- Woods, P. M., Kaspi, V. M., Thompson, C., et al. 2004, ApJ, 605, 378 [NASA ADS] [CrossRef] [Google Scholar]
All Tables
All Figures
|
Fig. 1 Mass versus equatorial radius of rotating 12C white dwarfs (Boshkayev et al. 2013). The solid black curves correspond to J = constant sequences, where the static case J = 0 is the thickest one. The colored thin dashed curves correspond to P = constant sequences. The Keplerian sequence is the red thick dashed curve, the blue thick dotted-dashed curve is the inverse β instability boundary, and the green thick dotted curve is the axisymmetric instability line. The orange and purple dashed boundaries correspond to the pycnonuclear C+C fusion densities with reaction mean times τpyc = 10 Gyr and 0.1 Myr, respectively. The gray-shaded region is the stability region of rotating white dwarfs. |
| In the text | |
|
Fig. 2 Temperature-radius constraint given by Eq. (16). The gray region corresponds to the possible values for the temperature and the radius of the white dwarf. The range of radii corresponds to the one defined by the minimum and maximum mean radius of SGR 0418+5729, which was inferred from the white dwarf stability analysis and summarized in Table 1. |
| In the text | |
|
Fig. 3 Expected optical magnitudes of SGR 0418+5729 obtained assuming a simple blackbody for the spectral emission from a white dwarf with surface temperature T = 104 K and a radius of 1.5 × 108 cm, according to the constraints shown in Fig. 2. |
| In the text | |
|
Fig. 4 Expected optical magnitudes of SGR 1822-1606, assuming a blackbody spectral emission from a white dwarf with surface temperature T = 104 K and a radius of 1.5 × 108 cm. |
| In the text | |
|
Fig. 5 Observed and fitted spectrum of 1E 2259+586. The filled circle is the observed flux in the Ks band, and the triangles are the upper limits in the R, I, and J bands. The parameters of the blackbody+disk spectrum are RWD = 3.0 × 108 cm, T = 7.0 × 10⁴ K, Tin = 2.0 × 10³ K, and Rout = R⊙. The blue-dashed curve is the contribution of the disk and the red-dashed curve is the contribution from a pure blackbody. The total spectrum is represented by the solid black curve. |
| In the text | |
Current usage metrics show cumulative count of Article Views (full-text article views including HTML views, PDF and ePub downloads, according to the available data) and Abstracts Views on Vision4Press platform.
Data correspond to usage on the plateform after 2015. The current usage metrics is available 48-96 hours after online publication and is updated daily on week days.
Initial download of the metrics may take a while.