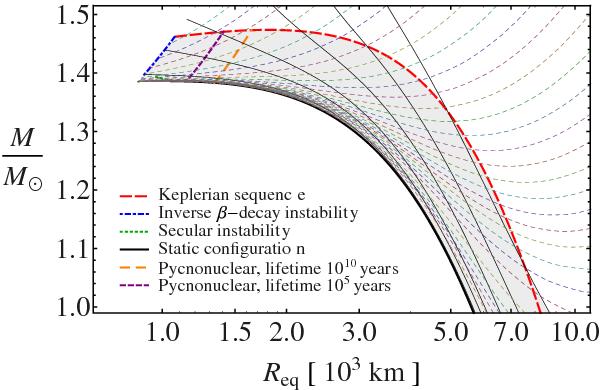
Fig. 1
Mass versus equatorial radius of rotating 12C white dwarfs (Boshkayev et al. 2013). The solid black curves correspond to J = constant sequences, where the static case J = 0 is the thickest one. The colored thin dashed curves correspond to P = constant sequences. The Keplerian sequence is the red thick dashed curve, the blue thick dotted-dashed curve is the inverse β instability boundary, and the green thick dotted curve is the axisymmetric instability line. The orange and purple dashed boundaries correspond to the pycnonuclear C+C fusion densities with reaction mean times τpyc = 10 Gyr and 0.1 Myr, respectively. The gray-shaded region is the stability region of rotating white dwarfs.
Current usage metrics show cumulative count of Article Views (full-text article views including HTML views, PDF and ePub downloads, according to the available data) and Abstracts Views on Vision4Press platform.
Data correspond to usage on the plateform after 2015. The current usage metrics is available 48-96 hours after online publication and is updated daily on week days.
Initial download of the metrics may take a while.