Fig. 3
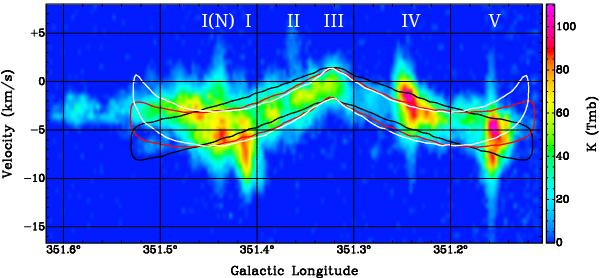
Position−velocity diagram of the HCO+J = 3–2 transition of NGC 6334, integrated over the Galactic latitude axis with a cutoff at 3σ = 0.93 K at each velocity channel. The position of the FIR sources are labeled above. Overlaid in contours are the PVDs of the three best-fit models of Sect. 3.3. The contours are set at 50% of the integrated emission which corresponds to the average velocity width of 3.5 km s-1 of the filament in this figure. The white contour assumes an initial velocity of zero at the edges and the red contour that the filament has already contracted from 7 to 6 pc (both at i = 45°). The model in black contours is defined with a constant velocity value of v = 10 km s-1 and i = 68°.
Current usage metrics show cumulative count of Article Views (full-text article views including HTML views, PDF and ePub downloads, according to the available data) and Abstracts Views on Vision4Press platform.
Data correspond to usage on the plateform after 2015. The current usage metrics is available 48-96 hours after online publication and is updated daily on week days.
Initial download of the metrics may take a while.