Fig. 1
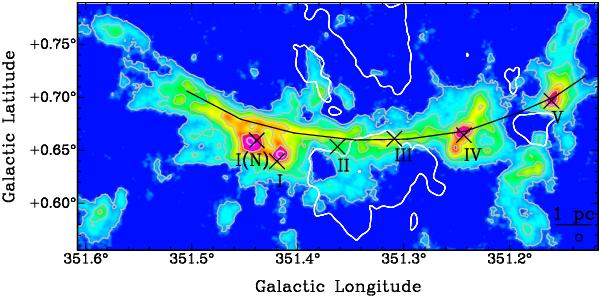
ATLASGAL map of NGC 6334. The continuum levels in gray are set at 0.3 (3σ), 1, 2, 5, 10, and 30 Jy/beam. The black line marks the main filament, black crosses denote FIR sources (Kraemer & Jackson 1999), and the beam width at 266 GHz is indicated in the lower-right corner. Overlaid in white contours (at 90% of the maximum intensity) is the Hα emission (Parker et al. 2005).
Current usage metrics show cumulative count of Article Views (full-text article views including HTML views, PDF and ePub downloads, according to the available data) and Abstracts Views on Vision4Press platform.
Data correspond to usage on the plateform after 2015. The current usage metrics is available 48-96 hours after online publication and is updated daily on week days.
Initial download of the metrics may take a while.