Free Access
Fig. 3
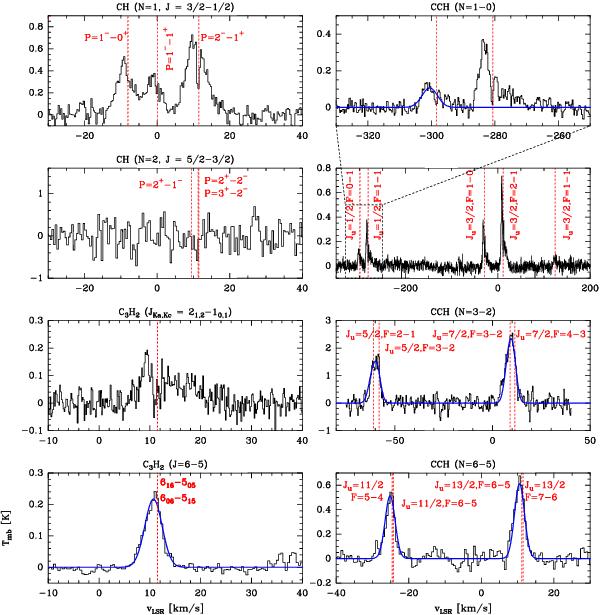
Herschel and IRAM observations of CCH and c-C3H2 towards the IF. 1 mm observations have been convolved to the spatial resolution of 39′′. Solid blue lines show the single-component Gaussian fits. The velocity scale in each panel is relative to the most intense line in the hyperfine groups (see also Tables 1 and B.1).
Current usage metrics show cumulative count of Article Views (full-text article views including HTML views, PDF and ePub downloads, according to the available data) and Abstracts Views on Vision4Press platform.
Data correspond to usage on the plateform after 2015. The current usage metrics is available 48-96 hours after online publication and is updated daily on week days.
Initial download of the metrics may take a while.