Fig. 1
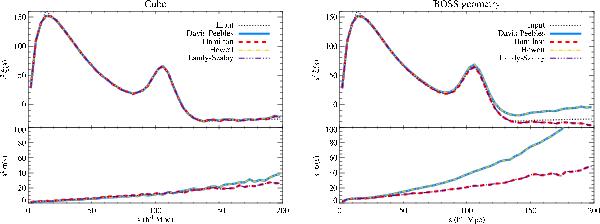
Input (dotted line) and reconstructed (various colours and linestyles, see legend) two-point correlation function obtained using the various estimators available in the literature for a cubic geometry (left) or a realistic (BOSS DR9) survey volume (right). The bottom panels show the root mean square of each estimator with corresponding colour and linestyle. In each case, the Hamilton and Landy-Szalay lines are exactly superposed as well as the Davis-Peebles and Hewett lines. (Coloured version of the figure available online).
Current usage metrics show cumulative count of Article Views (full-text article views including HTML views, PDF and ePub downloads, according to the available data) and Abstracts Views on Vision4Press platform.
Data correspond to usage on the plateform after 2015. The current usage metrics is available 48-96 hours after online publication and is updated daily on week days.
Initial download of the metrics may take a while.