Fig. 7
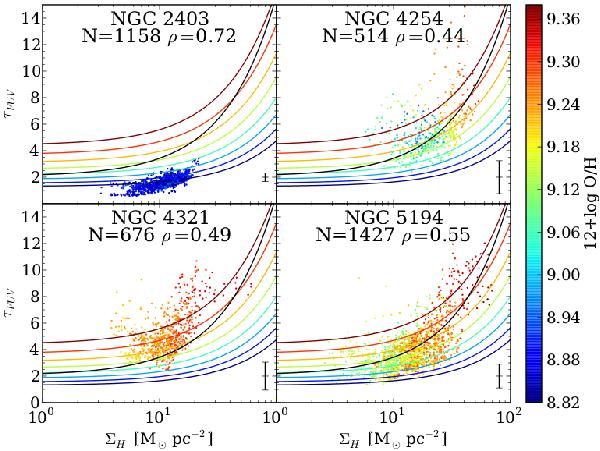
Face-on optical depth in the FUV band versus the total gas mass surface density in units of M⊙ pc-2. The colour of each point indicates the oxygen abundance determined from the gradients published by Zaritsky et al. (1994). The black line represents the best fit for the entire sample (Eq. (12)) when taking into account a metallicity-dependent XCO factor (Eq. (11)). The coloured lines represent the best fit for the entire sample (Eq. (13)) for different values of 12 + log O/H, when fitting the gas column density and the oxygen abundance simultaneously. At the top of each panel the number of datapoints and the Spearman correlation coefficient is indicated.
Current usage metrics show cumulative count of Article Views (full-text article views including HTML views, PDF and ePub downloads, according to the available data) and Abstracts Views on Vision4Press platform.
Data correspond to usage on the plateform after 2015. The current usage metrics is available 48-96 hours after online publication and is updated daily on week days.
Initial download of the metrics may take a while.