Fig. 6
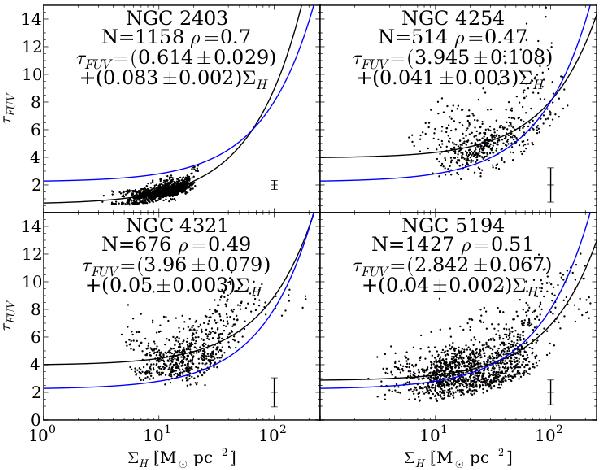
Face-on optical depth in the FUV band versus the total gas mass surface density in units of M⊙ pc-2 for a slab geometry, and assuming a metallicity-independent XCO factor. The blue curves represent the best fit for the full sample whereas the black curves represent the best fit for individual galaxies for which the equation is given at the top of each panel. The uncertainties on τFUV are indicated by the error bar at the bottom right of each panel.
Current usage metrics show cumulative count of Article Views (full-text article views including HTML views, PDF and ePub downloads, according to the available data) and Abstracts Views on Vision4Press platform.
Data correspond to usage on the plateform after 2015. The current usage metrics is available 48-96 hours after online publication and is updated daily on week days.
Initial download of the metrics may take a while.