Fig. 3
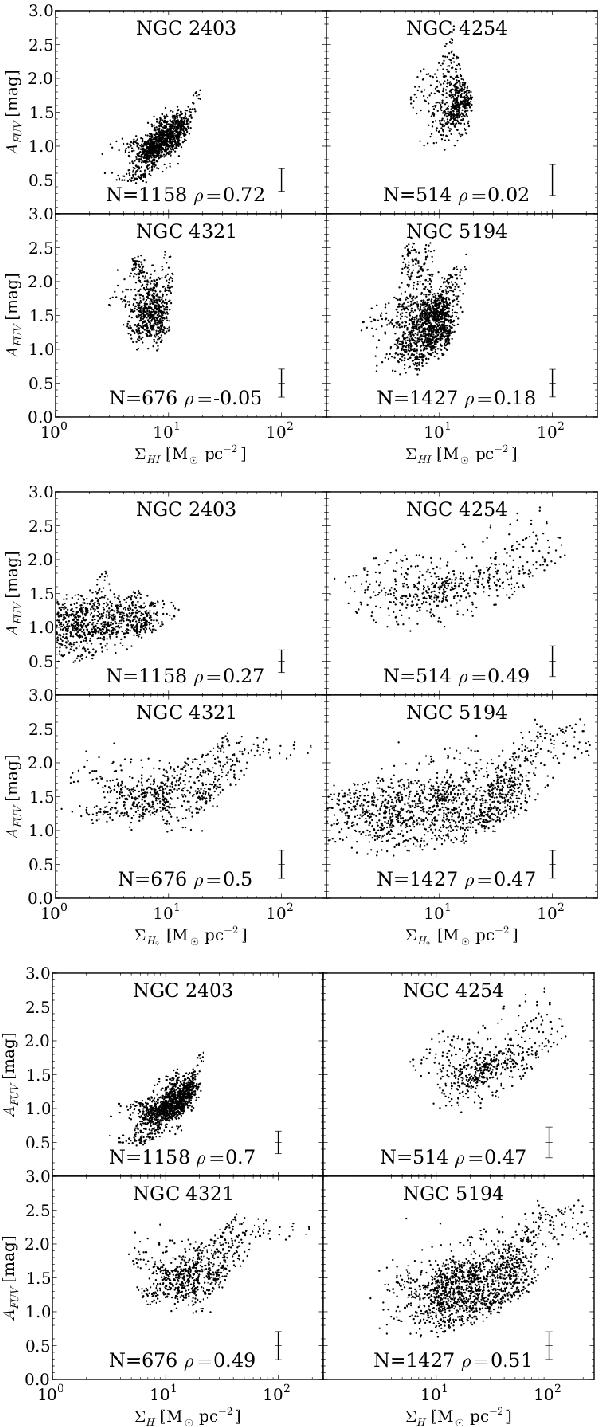
Attenuation in the FUV band versus the atomic (top), molecular (middle), and total (bottom) gas mass surface density in units of M⊙ pc-2 for individual regions in galaxies (sample A). Each data point corresponds to a single pixel which has been detected at a 3-σ level from the FUV to the FIR. No selection has been applied on CO and HI data. Data points with a poor fit (χ2 ≥ 2) have also been removed. At the bottom of each panel we display the number of selected pixels N and the Spearman correlation coefficient ρ. Finally, the median uncertainty on AFUV computed by CIGALE is indicated in the bottom-right corner.
Current usage metrics show cumulative count of Article Views (full-text article views including HTML views, PDF and ePub downloads, according to the available data) and Abstracts Views on Vision4Press platform.
Data correspond to usage on the plateform after 2015. The current usage metrics is available 48-96 hours after online publication and is updated daily on week days.
Initial download of the metrics may take a while.