Fig. H.2
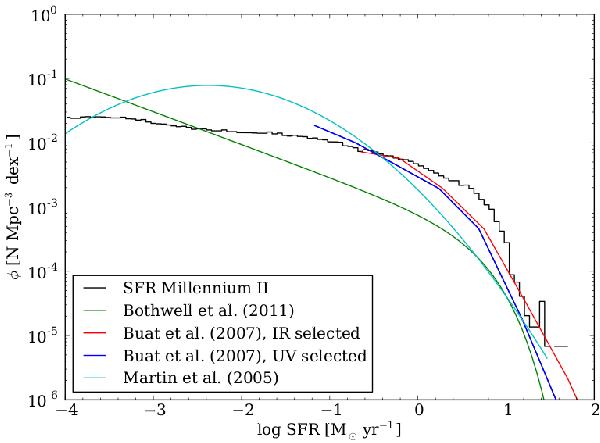
SFR function of the Millennium-II simulation (black line). For comparison, the Martin et al. (2005) function (cyan), the IR (red), and UV (blue) selected Buat et al. (2007) functions, and the Bothwell et al. (2011) functions observed in the local universe have also been plotted. All functions have been scaled to h = 0.73 and to a Chabrier (2003) IMF.
Current usage metrics show cumulative count of Article Views (full-text article views including HTML views, PDF and ePub downloads, according to the available data) and Abstracts Views on Vision4Press platform.
Data correspond to usage on the plateform after 2015. The current usage metrics is available 48-96 hours after online publication and is updated daily on week days.
Initial download of the metrics may take a while.