Fig. 2
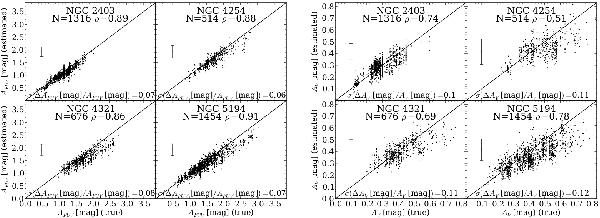
Attenuation derived from the analysis of the probability distribution function performed with CIGALE versus the true value for artificial regions in galaxies, in order to test the accuracy of the modelling. In each quadrant we indicate the number of data points N, the Spearman correlation coefficient ρ at the top, and the scatter of the relative difference in the attenuation at the bottom. The solid black line indicates the 1-to-1 relation. The error bar on the left indicates the median uncertainty as computed from the analysis of the probability distribution function. For consistency with the analysis carried out later in this paper, we have only selected datapoints with a good best fit (χ2 < 2). The left panel describes the FUV-band attenuation whereas the right one describes the V-band attenuation.
Current usage metrics show cumulative count of Article Views (full-text article views including HTML views, PDF and ePub downloads, according to the available data) and Abstracts Views on Vision4Press platform.
Data correspond to usage on the plateform after 2015. The current usage metrics is available 48-96 hours after online publication and is updated daily on week days.
Initial download of the metrics may take a while.