Fig. D.1
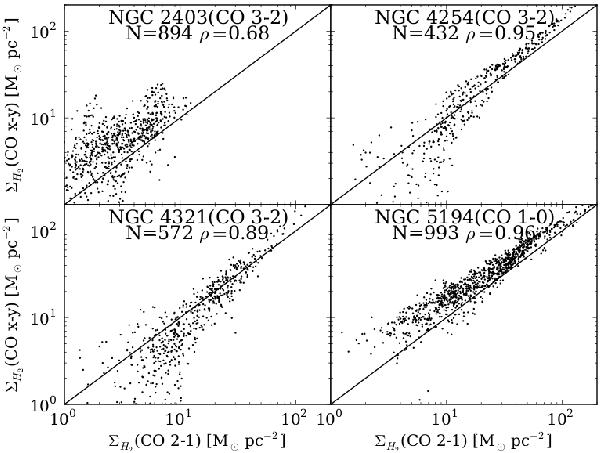
Molecular gas surface densities computed from CO(3 − 2) observations (CO(1 − 0) for NGC 5194) versus the molecular gas surface densities computed from the CO(2 − 1) transition. All CO lines have been scaled to the CO(1 − 0) line in order to apply the same XCO factor. The black line represents the 1-to-1 relation where both lines yield the same molecular gas surface densities.
Current usage metrics show cumulative count of Article Views (full-text article views including HTML views, PDF and ePub downloads, according to the available data) and Abstracts Views on Vision4Press platform.
Data correspond to usage on the plateform after 2015. The current usage metrics is available 48-96 hours after online publication and is updated daily on week days.
Initial download of the metrics may take a while.