Fig. 10
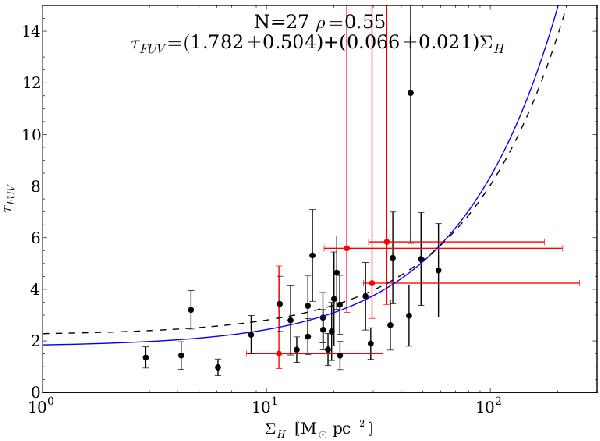
Relation between the FUV face-on optical depth and the gas surface density for unresolved galaxies (black circles with error bars). The blue line corresponds to the best linear fit for the unresolved sample. The corresponding relation is indicated at the top of the figure, along with the number of elements and the Spearman correlation coefficient. The black dashed line corresponds to the relation for resolved galaxies when assuming a solar metallicity (Eq. (10)). The absence of metallicity estimates for a number of galaxies prevents us from using a metallicity-dependent XCO factor. The red dots represent the four galaxies in sample A, with the bars indicating the full dynamical range probed by each of them.
Current usage metrics show cumulative count of Article Views (full-text article views including HTML views, PDF and ePub downloads, according to the available data) and Abstracts Views on Vision4Press platform.
Data correspond to usage on the plateform after 2015. The current usage metrics is available 48-96 hours after online publication and is updated daily on week days.
Initial download of the metrics may take a while.