Fig. 1
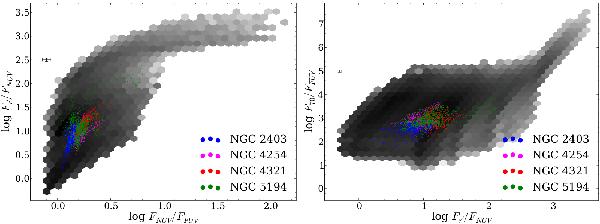
Comparison between observed and modelled flux ratios. The shade of the grey hexagons represents the logarithm of the density of models, with a darker shade indicating a higher number of models in the bin. The observed fluxes are indicated by circles, the colour depending on the galaxy. The median error bars including systematic uncertainties are shown on the upper-left side of the plots. The left plot shows the r′/NUV versus NUV/FUV flux ratios and the right plot shows the 70/FUV versus r′/NUV flux ratios.
Current usage metrics show cumulative count of Article Views (full-text article views including HTML views, PDF and ePub downloads, according to the available data) and Abstracts Views on Vision4Press platform.
Data correspond to usage on the plateform after 2015. The current usage metrics is available 48-96 hours after online publication and is updated daily on week days.
Initial download of the metrics may take a while.