Fig. 6
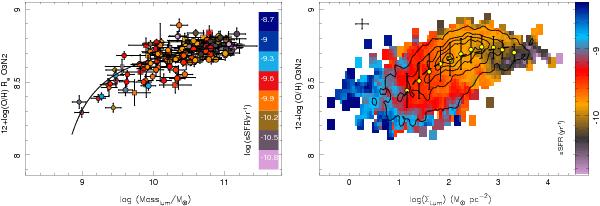
Left panel: same distribution of the characteristic oxygen abundance as a function of the stellar mass as shown in the bottom panel of Fig. 4. Right panel: same distribution of the oxygen abundances as a function of the stellar surface density for the individualH ii regions as shown in the bottom panel of Fig. 5. In both cases, the color code indicates the logarithm of the specific star formation rate.

Current usage metrics show cumulative count of Article Views (full-text article views including HTML views, PDF and ePub downloads, according to the available data) and Abstracts Views on Vision4Press platform.
Data correspond to usage on the plateform after 2015. The current usage metrics is available 48-96 hours after online publication and is updated daily on week days.
Initial download of the metrics may take a while.