Fig. 5
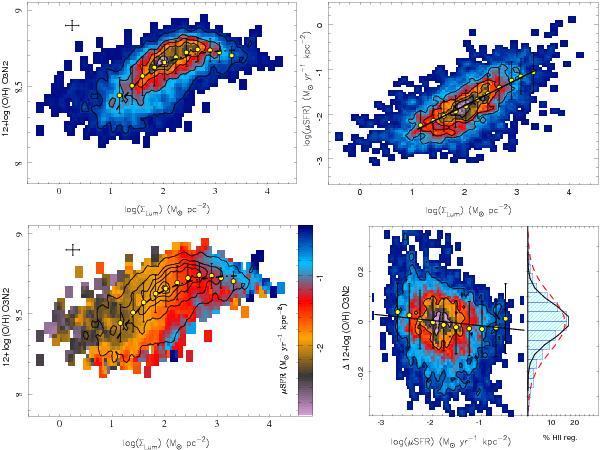
. Top-left panel: distribution of the oxygen abundances for the 3000 individualH ii regions extracted from the CALIFA data as a function of the surface mass density, represented with a density contour-plot. The first contour encircles 95% of the total number ofH ii regions, with ~ 20% less in each consecutive contour. The solid-yellow points represent the average oxygen abundances, with their corresponding standard deviations indicated as error bars for consecutive bins of 0.1 dex in surface mass density. The dot-dashed line represents the best-fitted curve for these points. Top-right panel: distribution of the SFR surface density as a function of the stellar mass density of each individualH ii region. The contour plots represent the density of points in the distribution of oxygen abundances as a function of the surface SFR densities, with the same encircled numbers as in the previous panel. Bottom-left panel: same distribution shown in the top-left panel, for the CALIFA and feasibility-studies objects. The colors represent the logarithm of the integrated surface density of the SFR for eachH ii region. Bottom-right panel: distribution of the differential oxygen abundance, once the dependency with the surface mass density has been subtracted, for individualH ii regions. The contour plots represent the density of points in the distribution of differential oxygen abundances, once subtracted the dependence on the surface masses densities, as a function of the surface SFR densities, with the same encircled numbers as in the previous panel. The solid-yellow points represent the average values for the abundance offsets, with their corresponding standard deviations indicated as error bars, for consecutive bins of 0.1 dex in surface SFR density.

Current usage metrics show cumulative count of Article Views (full-text article views including HTML views, PDF and ePub downloads, according to the available data) and Abstracts Views on Vision4Press platform.
Data correspond to usage on the plateform after 2015. The current usage metrics is available 48-96 hours after online publication and is updated daily on week days.
Initial download of the metrics may take a while.