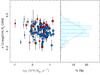
Fig. 4
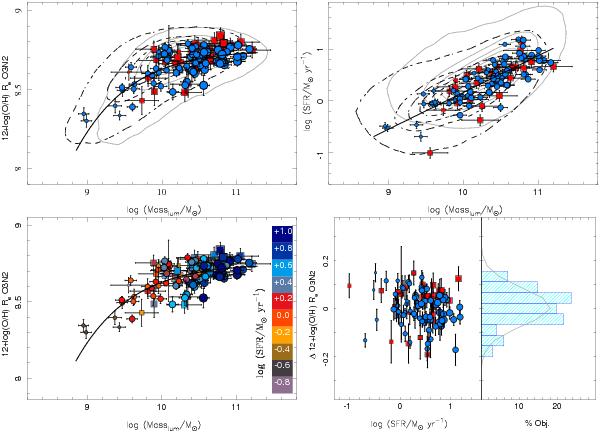
. Top-left panel: distribution of the oxygen abundances at the effective radii as a function of the integrated stellar masses for the CALIFA galaxies (113, blue solid circles). For comparison purposes, we show similar values for the galaxies observed in the CALIFA feasibility studies (31, red solid squares) included in theH ii regions catalog described in Sánchez et al. (2012b). The size of the symbols is proportional to the integrated SFR. The solid line represents the best-fitted curve, as described in the text. We also included the distribution of abundaces as a function of the stellar masses for the SDSS data corresponding to the redshift ranges sampled by Lara-López et al. (2010), dashed black contours, and Mannucci et al. (2010), solid grey contours. In both cases, the first contour encircles the 95% of the objects, and 20% less objects in each consecutive contour. Top-right panel: distribution of the integrated SFR as a function of the stellar masses. The size of the symbols is proportional to the oxygen abundance shown in previous panel. The solid line represents the best fitted linear regression to the CALIFA data.Like in the previos panel the contours represent the distribution of both parameters corresponding to the redshift ranges sampled by Lara-López et al. (2010), dashed black contours, and Mannucci et al. (2010), solid grey contours Bottom-left panel: same distribution shown in the top-left panel, for the CALIFA and feasibility-studies objects. The colors represent the logarithm of the integrated SFR for each galaxy. Bottom-right Panel: distribution of the differential oxygen abundances at the effective radii, once the dependency with the stellar mass has been subtracted, as a function of the integrated SFR for the CALIFA galaxies (113, blue solid circles). The size of the symbols is proportional to the oxygen abundances shown in Fig. 4. The histogram shows the same distribution of differential oxygen abundances. The solid line represents a Gaussian function with the same central value (0.01 dex) and standard deviation (0.07 dex) as the represented distribution, scaled to match the histogram.
Current usage metrics show cumulative count of Article Views (full-text article views including HTML views, PDF and ePub downloads, according to the available data) and Abstracts Views on Vision4Press platform.
Data correspond to usage on the plateform after 2015. The current usage metrics is available 48-96 hours after online publication and is updated daily on week days.
Initial download of the metrics may take a while.