Fig. 1
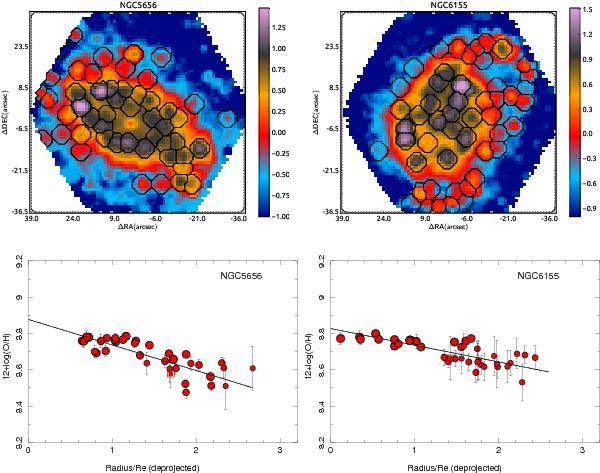
Top panels: IFS-based Hα maps, in units of 10-16 erg s-1 cm-2 arcsec-2, derived for two representative galaxies of the sample (color images), together with the detectedH iiregions shown as black segmented contours. Bottom panels: radial distribution of the oxygen abundance derived for the individualH iiregions with abundace errors below 0.15 dex, as a function of the deprojected distance (i.e., corrected for inclination), normalized to the effective radius, for the same galaxies. The size of the circles is proportional to the Hα intensity.
Current usage metrics show cumulative count of Article Views (full-text article views including HTML views, PDF and ePub downloads, according to the available data) and Abstracts Views on Vision4Press platform.
Data correspond to usage on the plateform after 2015. The current usage metrics is available 48-96 hours after online publication and is updated daily on week days.
Initial download of the metrics may take a while.