Free Access
Fig. 9
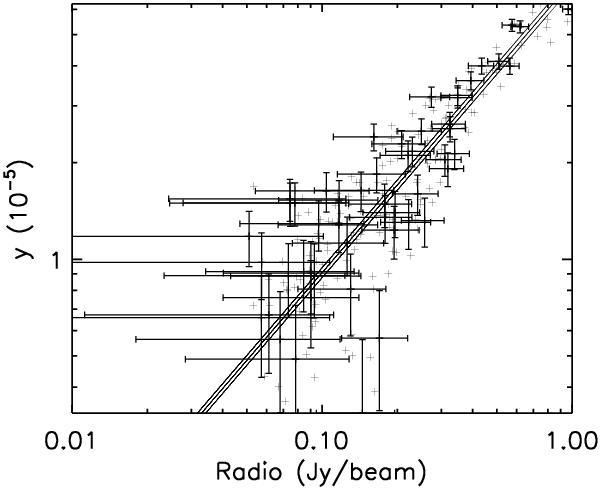
Scatter plot between the radio map after smoothing to FWHM = 10′ and the y signal for the Coma cluster. To make the plot clearer, we show errors only for some points.
Current usage metrics show cumulative count of Article Views (full-text article views including HTML views, PDF and ePub downloads, according to the available data) and Abstracts Views on Vision4Press platform.
Data correspond to usage on the plateform after 2015. The current usage metrics is available 48-96 hours after online publication and is updated daily on week days.
Initial download of the metrics may take a while.