Fig. 4
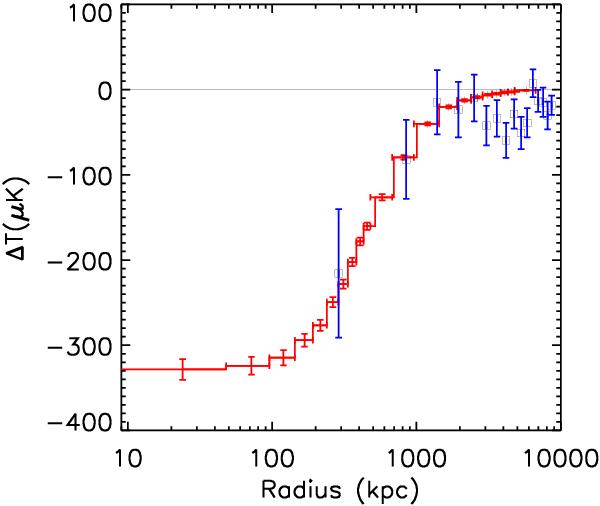
Comparison of the radial profile of the SZ effect towards the Coma cluster, in units of the Rayleigh-Jeans equivalent temperature measured by Planck (crosses) with the one obtained by WMAP (open squares) using the optimal V and W band data (from Fig. 14 of Komatsu et al. 2011). The plotted Planck errors are the square root of the diagonal elements of the covariance matrix. Notice that profiles have been extracted from SZ maps with 10′ and 30′ angular resolution from Planck and WMAP, respectively.
Current usage metrics show cumulative count of Article Views (full-text article views including HTML views, PDF and ePub downloads, according to the available data) and Abstracts Views on Vision4Press platform.
Data correspond to usage on the plateform after 2015. The current usage metrics is available 48-96 hours after online publication and is updated daily on week days.
Initial download of the metrics may take a while.