Fig. 2
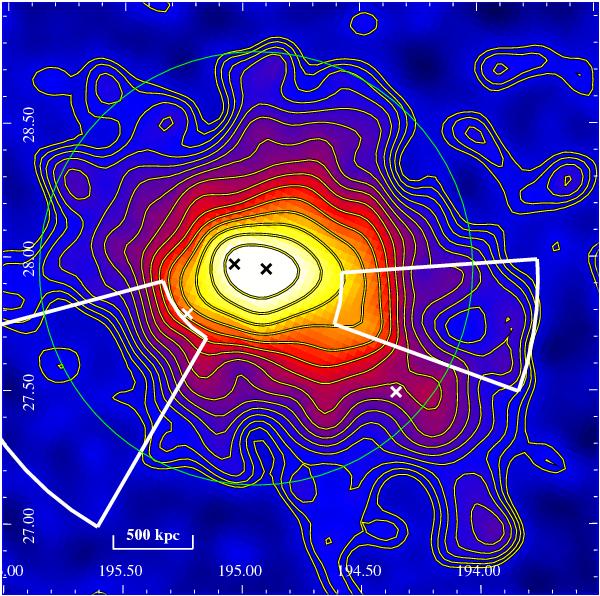
The Plancky map of the Coma cluster obtained by combining the HFI channels from 100 GHz to 857 GHz. North is up and west is to the right. The map is corrected for the additive constant yoff. The final map bin corresponds to FWHM = 10′. The image is about 130 arcmin × 130 arcmin. The contour levels are logarithmically spaced by 21/4 (every 4 lines, y increases by a factor 2). The outermost contour corresponds to y = 2 × σnoise = 4.6 × 10⁻⁶. The green circle indicates R500. White and black crosses indicate the position of the brightest galaxies in Coma. The white sectors indicate two regions where the y map shows a local steepening of the radial gradient (see Sect. 7 and Fig. 6).
Current usage metrics show cumulative count of Article Views (full-text article views including HTML views, PDF and ePub downloads, according to the available data) and Abstracts Views on Vision4Press platform.
Data correspond to usage on the plateform after 2015. The current usage metrics is available 48-96 hours after online publication and is updated daily on week days.
Initial download of the metrics may take a while.