Fig. A.3
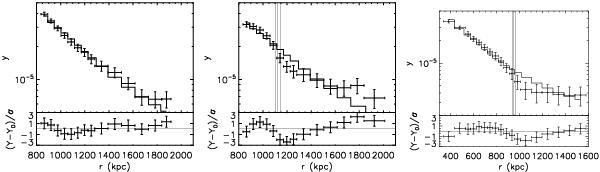
Results of the fit of the y profile extracted from three cluster sectors with a simple power law. Left panel: sector with the same angular size and extension as the west shock but pointing to the north, where there are no visible shock features. Middle panel: profile of the west shock. Right panel: profile of the south-east shock. In the lower panel of each figure we report the ratio between the observed and the best-fit model of the projected y profile in units of the relative error. The figure clearly illustrates that while the power law gives a good fit for the north sector where no shock is present, it returns a poor fit in the west and south-east sectors. These two cluster regions require a discontinuity in the pressure jump, as shown in Fig. 6.
Current usage metrics show cumulative count of Article Views (full-text article views including HTML views, PDF and ePub downloads, according to the available data) and Abstracts Views on Vision4Press platform.
Data correspond to usage on the plateform after 2015. The current usage metrics is available 48-96 hours after online publication and is updated daily on week days.
Initial download of the metrics may take a while.