Fig. A.2
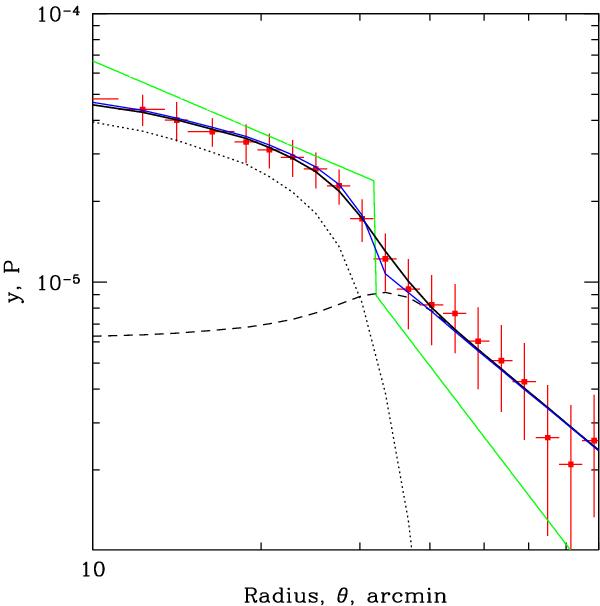
Comparison of the 3D pressure model (green line) and the corresponding projected y profile, smoothed with the 10′ beam. The dotted black line shows the expected y profile due to the inner power component, while the dashed line shows the contribution of the outer power law component. The black solid line is the sum of these two components. For comparison, the blue line shows the same model, but not convolved with the 10′ beam. In this plot rJ ~ 30′. Due to projection effects, the range of radii affected by the value of rJ is of order rJ itself. Since rJ exceeds 10′, many independent data points with large signal-to-noise ratio contributes to the determination of rJ, allowing rJ to be estimated with an uncertainty below the nominal angular resolution of the telescope.
Current usage metrics show cumulative count of Article Views (full-text article views including HTML views, PDF and ePub downloads, according to the available data) and Abstracts Views on Vision4Press platform.
Data correspond to usage on the plateform after 2015. The current usage metrics is available 48-96 hours after online publication and is updated daily on week days.
Initial download of the metrics may take a while.