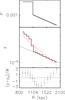
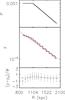
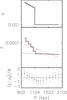
Fig. A.1
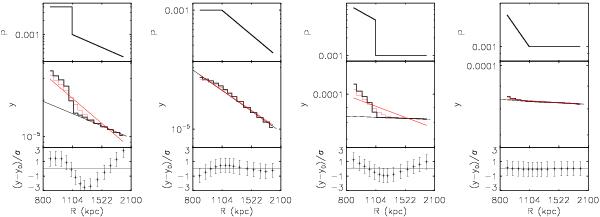
Histogram of the effects of projection and Planck PSF on the y radial profile produced by an underlying broken power law pressure profile with and without a pressure discontinuity. In this figure we fix P0 = 10. × 10-4 cm-3 keV, rJ = 1.1 Mpc and, from left to right we consider four different cases: i) η1 = 0 , η2 = 2, DJ = 4; ii) η1 = 0 , η2 = 2, DJ = 1; iii) η1 = 2 , η2 = 0, DJ = 4; and iv) η1 = 2 , η2 = 0, DJ = 1. Upper panels: the underlying 3D pressure profile. Middle panels: the black and red histograms are the projected y profiles observed by an instrument with infinite angular resolution and with a PSF of 10 arcmin, respectively. The red line represents the best-fit of a simple power law to the entire convolved profile (red histogram). The black line is the same as the red line, but considering only the three outermost projected profile bins. Lower panels: ratio between the PSF-convolved and projected y profile and its best-fit power law model (red histogram and lines in middle panel) in units of a relative error, which, for this illustration, we set to 10%.
Current usage metrics show cumulative count of Article Views (full-text article views including HTML views, PDF and ePub downloads, according to the available data) and Abstracts Views on Vision4Press platform.
Data correspond to usage on the plateform after 2015. The current usage metrics is available 48-96 hours after online publication and is updated daily on week days.
Initial download of the metrics may take a while.