Fig. 15
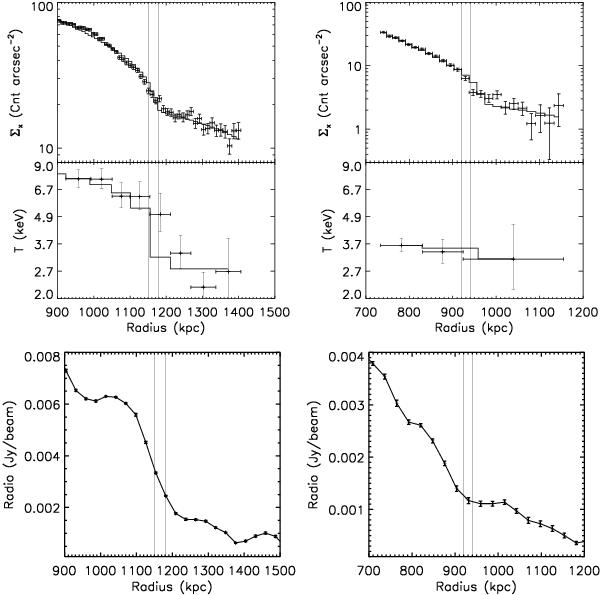
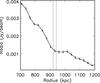
Comparison of the X-ray and radio properties in the west (left panels) and south-east (right panels) sectors. Upper panels: surface brightness and temperature profiles of the XMM-Newton mosaic. The continuous histograms show the best-fit models. The 3D pressure model is overplotted in Fig. 7. Lower panels: radial profiles of 352 MHz radio emission at 2 arcmin resolution in the west (left) and south-east (right) sectors after subtraction of radio emission from compact sources (see Brown & Rudnick 2011). The two vertical lines mark the position range of the inferred jumps.
Current usage metrics show cumulative count of Article Views (full-text article views including HTML views, PDF and ePub downloads, according to the available data) and Abstracts Views on Vision4Press platform.
Data correspond to usage on the plateform after 2015. The current usage metrics is available 48-96 hours after online publication and is updated daily on week days.
Initial download of the metrics may take a while.