Fig. 13
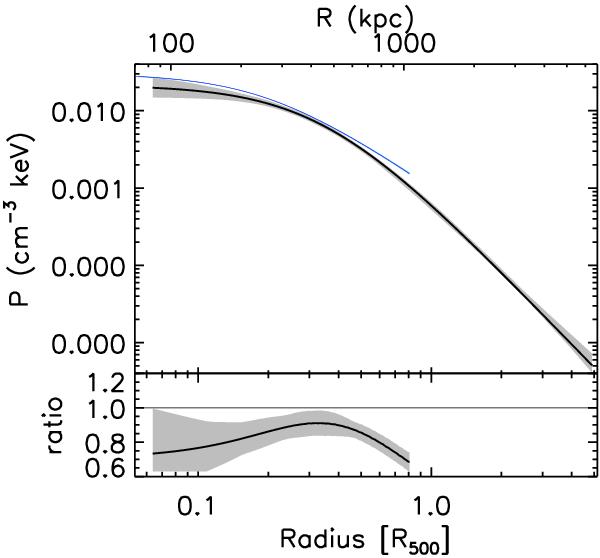
Comparison between the Planck and XMM-Newton derived deprojected total pressure profiles. Upper panel: blue line and light blue shaded region are the deprojected pressure profile, with its 68.4% confidence level errors, obtained from the X-ray analysis of the XMM-Newton data (see text). The black line and grey shaded regions are the best-fit and 68.4% confidence level errors from the Model C pressure profile resulting from the fit shown in Fig. 5. Lower panel: ratio between the XMM-Newton and Planck derived pressure profiles. The black line and the grey shading indicate the best-fit and the 68.4% confidence level errors, respectively.
Current usage metrics show cumulative count of Article Views (full-text article views including HTML views, PDF and ePub downloads, according to the available data) and Abstracts Views on Vision4Press platform.
Data correspond to usage on the plateform after 2015. The current usage metrics is available 48-96 hours after online publication and is updated daily on week days.
Initial download of the metrics may take a while.