Fig. 12
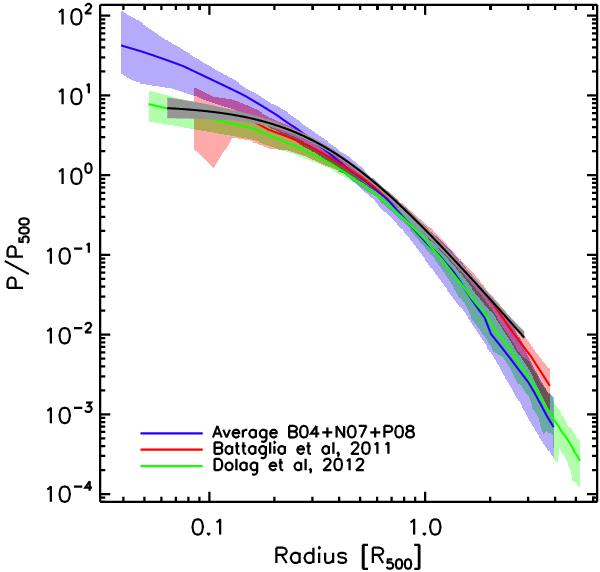
Scaled Coma pressure profile with relative errors (black line and gray shaded region) overplotted on the scaled pressure profiles derived from numerical simulations of B04+N07+P08 (blue line and violet shaded region), Battaglia et al. (2012, red line and shaded region), and Dolag et al. (in prep., green line and light green shaded region).
Current usage metrics show cumulative count of Article Views (full-text article views including HTML views, PDF and ePub downloads, according to the available data) and Abstracts Views on Vision4Press platform.
Data correspond to usage on the plateform after 2015. The current usage metrics is available 48-96 hours after online publication and is updated daily on week days.
Initial download of the metrics may take a while.