Fig. 1
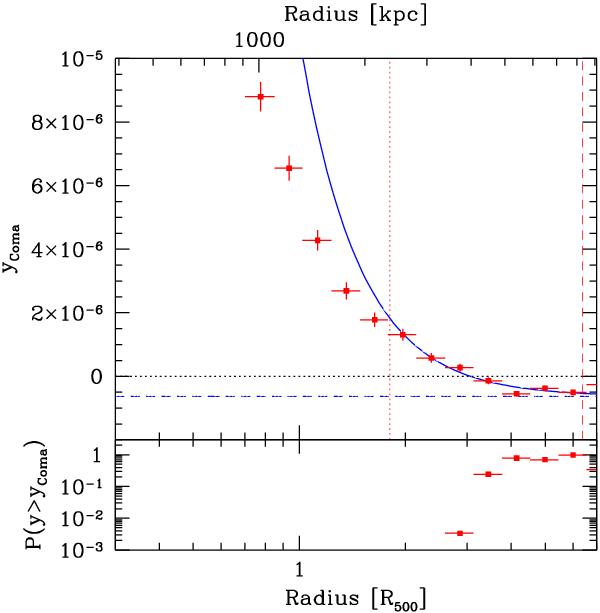
Upper panel: radial profile of y in a set of circular annuli centred on Coma. The blue curve is the best fitting simple model to the profile over the radial range from 85 arcmin to 300 arcmin. The model consists of a power law plus a constant yoff. The best fitting value of yoff is shown with the dashed horizontal line. Two vertical lines indicate the range of radii used for fitting. Lower panel: the probability of finding an observed value of y > yComa in a given annulus. The probability was estimated by measuring y in a set of annuli with random centres in any part of the image outside 5 × R500, where R500 = 47 arcmin.
Current usage metrics show cumulative count of Article Views (full-text article views including HTML views, PDF and ePub downloads, according to the available data) and Abstracts Views on Vision4Press platform.
Data correspond to usage on the plateform after 2015. The current usage metrics is available 48-96 hours after online publication and is updated daily on week days.
Initial download of the metrics may take a while.