Free Access
Fig. 9
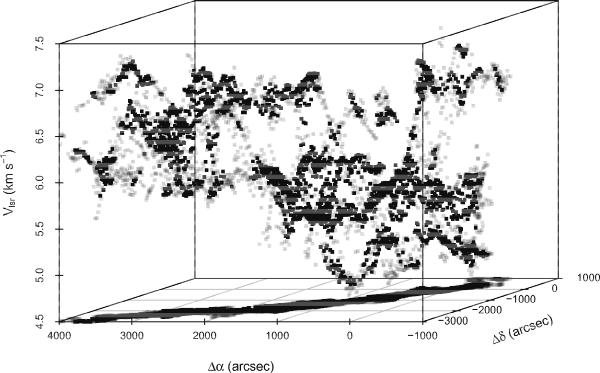
Position–position–velocity cube showing the line-center velocities derived from the Gaussian fit to the C18O(1−0) and N2H+(1−0) spectra towards the B211-B213 region presented in Fig. 8. Semi-transparent points have intensities between 3 and 6 times rms and opaque points have intensities higher than or equal to 6 rms.
Current usage metrics show cumulative count of Article Views (full-text article views including HTML views, PDF and ePub downloads, according to the available data) and Abstracts Views on Vision4Press platform.
Data correspond to usage on the plateform after 2015. The current usage metrics is available 48-96 hours after online publication and is updated daily on week days.
Initial download of the metrics may take a while.