Fig. 2
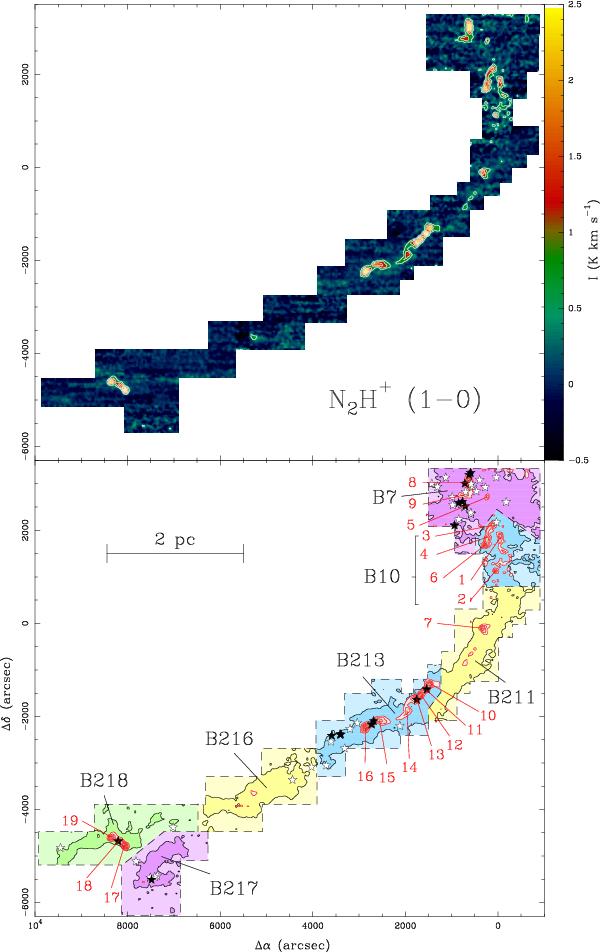
Top: integrated intensity map of L1495/B213 in N2H+(1−0) adding all hyperfine components. The white contour corresponds to 0.5 K km s-1. Central position and offsets are as in Fig. 1. First contour and contour interval are 0.5 K km s-1. Bottom: schematic view of the L1495/B213 complex indicating the regions defined in this paper, which approximately match those of Barnard (1927). The black solid line represents the lowest C18O(1−0) contour in Fig. 1 and delineates the boundary of the cloud. The red lines represent the N2H+(1−0) emission, which traces the dense cores, and the red labels identify the cores described in Sect. 4 and summarized in Table 2. The stars correspond to stellar objects from the survey of Rebull et al. (2010). Solid symbols represent the youngest objects (Class I and Flat), and open symbols represent evolved objects (Classes II and III).
Current usage metrics show cumulative count of Article Views (full-text article views including HTML views, PDF and ePub downloads, according to the available data) and Abstracts Views on Vision4Press platform.
Data correspond to usage on the plateform after 2015. The current usage metrics is available 48-96 hours after online publication and is updated daily on week days.
Initial download of the metrics may take a while.