Fig. B.1
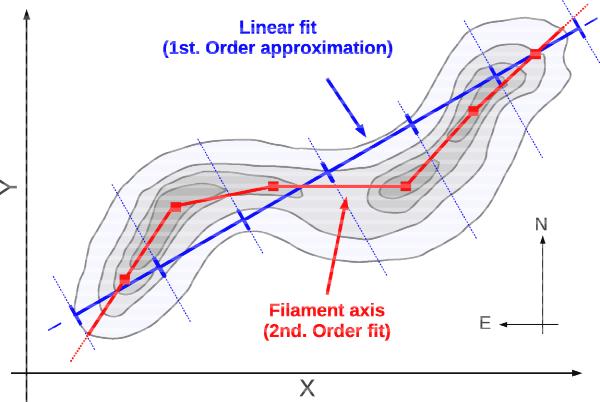
Schematic view of the two-step process used to determine the principal axis of a filamentary velocity component. The gray-scale and contours represent the C18O(1−0) emission. The blue straight line is the first-step determination of the principal axis, and the red polygonal curve is the second-step determination of the axis.
Current usage metrics show cumulative count of Article Views (full-text article views including HTML views, PDF and ePub downloads, according to the available data) and Abstracts Views on Vision4Press platform.
Data correspond to usage on the plateform after 2015. The current usage metrics is available 48-96 hours after online publication and is updated daily on week days.
Initial download of the metrics may take a while.