Fig. A.2
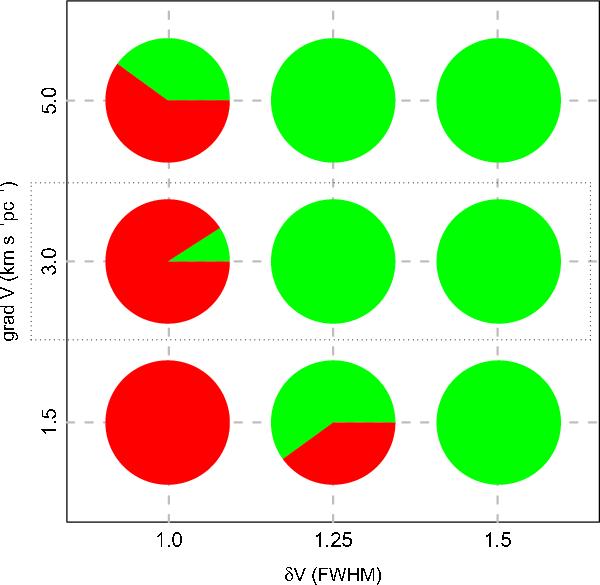
“Traffic-light” diagram showing the rates of success and failure of the FIVE algorithm when disentangling a model cloud that consists of two components that overlap in position but differ in velocity. The diagram represents a matrix of pie charts, each of them showing the fraction of success (green) and failure (red) for 10 independent models with a given velocity difference between the components (in units of the spectral line FWHM, x-axis) and a maximum velocity gradient used in the definition of friend (y-axis). The horizontal box encloses the results for the favored gradient of 3 km s-1pc-1. (All models use a number of neighbors of 5 and an intensity threshold of 6 rms, as recommended by the results shown in Fig. A.3.)
Current usage metrics show cumulative count of Article Views (full-text article views including HTML views, PDF and ePub downloads, according to the available data) and Abstracts Views on Vision4Press platform.
Data correspond to usage on the plateform after 2015. The current usage metrics is available 48-96 hours after online publication and is updated daily on week days.
Initial download of the metrics may take a while.