Free Access
Fig. 1
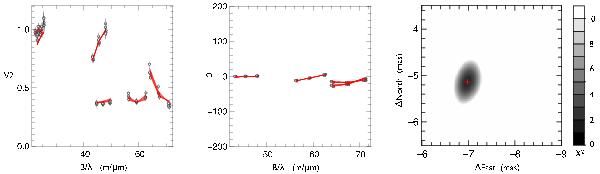
Calibrated visibilities (left panel) and closure phases (middle panel) from PIONIER in August 2012, overlaid with the best fit binary model (red solid lines). The right panel shows the χ2 map in the vicinity of the best-fit solution.
Current usage metrics show cumulative count of Article Views (full-text article views including HTML views, PDF and ePub downloads, according to the available data) and Abstracts Views on Vision4Press platform.
Data correspond to usage on the plateform after 2015. The current usage metrics is available 48-96 hours after online publication and is updated daily on week days.
Initial download of the metrics may take a while.