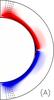
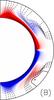
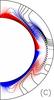
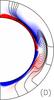
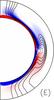
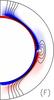
Fig. 2
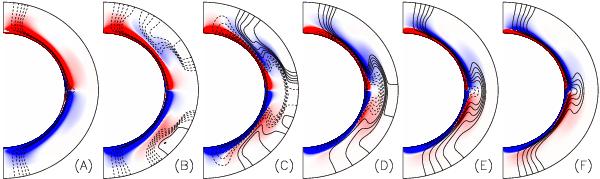
Simulated variation of the magnetic field over cycle 19. The red and blue colors correspond to negative and positive toroidal fields, respectively. The solid (dashed) lines represent anti-clockwise (clockwise) orientated field lines of the poloidal field. The snapshots (A)−(F) cover cycle 19, corresponding to t = 1956, 1958, 1960, 1962, 1964, and 1966, respectively.
Current usage metrics show cumulative count of Article Views (full-text article views including HTML views, PDF and ePub downloads, according to the available data) and Abstracts Views on Vision4Press platform.
Data correspond to usage on the plateform after 2015. The current usage metrics is available 48-96 hours after online publication and is updated daily on week days.
Initial download of the metrics may take a while.