Fig. 13
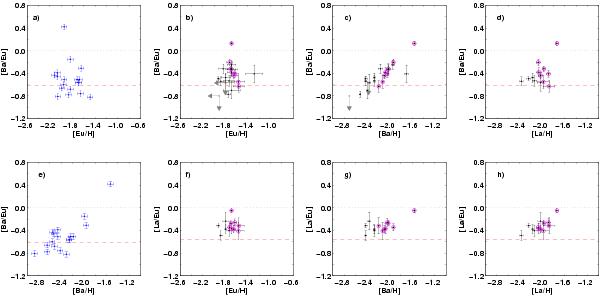
a) [Ba/Eu] against [Eu/H] for S97W13 (blue). Dotted red line indicates the solar abundance. Dashed red line indicates the expected abundance from r-process only yields (Simmerer et al. 2004). b) [Ba/Eu] against [Eu/H] for the W13 sample (black). Grey arrows are the upper limits derived from the set of summed spectra. Magenta circles identify those points with [Ba/H] greater than –2.20 dex and that have measurements for Ba, La and Eu. c) As for b) but for [Ba/Eu] against [Ba/H]. d) as for b) but for [Ba/Eu] against [La/H]. e) As for a) but for [Ba/Eu] against [Ba/H]. f) As for b) but for [La/Eu] against [Eu/H]. g) as for b) but for [La/Eu] against [Ba/H]. h) as for b) but for [La/Eu] against [La/H].
Current usage metrics show cumulative count of Article Views (full-text article views including HTML views, PDF and ePub downloads, according to the available data) and Abstracts Views on Vision4Press platform.
Data correspond to usage on the plateform after 2015. The current usage metrics is available 48-96 hours after online publication and is updated daily on week days.
Initial download of the metrics may take a while.