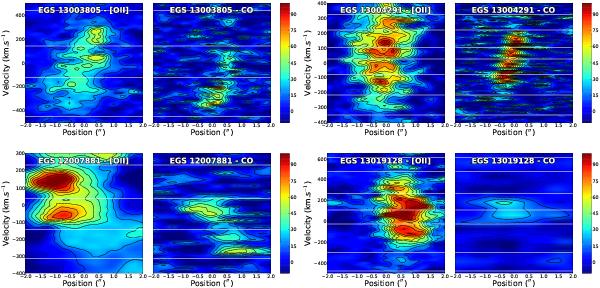
Fig. 2

[OII] line and CO luminosities (respectively left and right panels for each galaxy) in position-velocity planes corresponding to the DEEP2 slits. Smoothed ensembles of clumps are separated by eye along the vertical axis, as shown with the white horizontal lines. The [OII] diagrams were normalized in order to have fluxes proportional to the SFR, but all galaxies share the same arbitrary color scales. One arcsecond corresponds approximately to 8.5 kpc (Table 1).
Current usage metrics show cumulative count of Article Views (full-text article views including HTML views, PDF and ePub downloads, according to the available data) and Abstracts Views on Vision4Press platform.
Data correspond to usage on the plateform after 2015. The current usage metrics is available 48-96 hours after online publication and is updated daily on week days.
Initial download of the metrics may take a while.


